. 2023 May 15;12:e85410. doi: 10.7554/eLife.85410

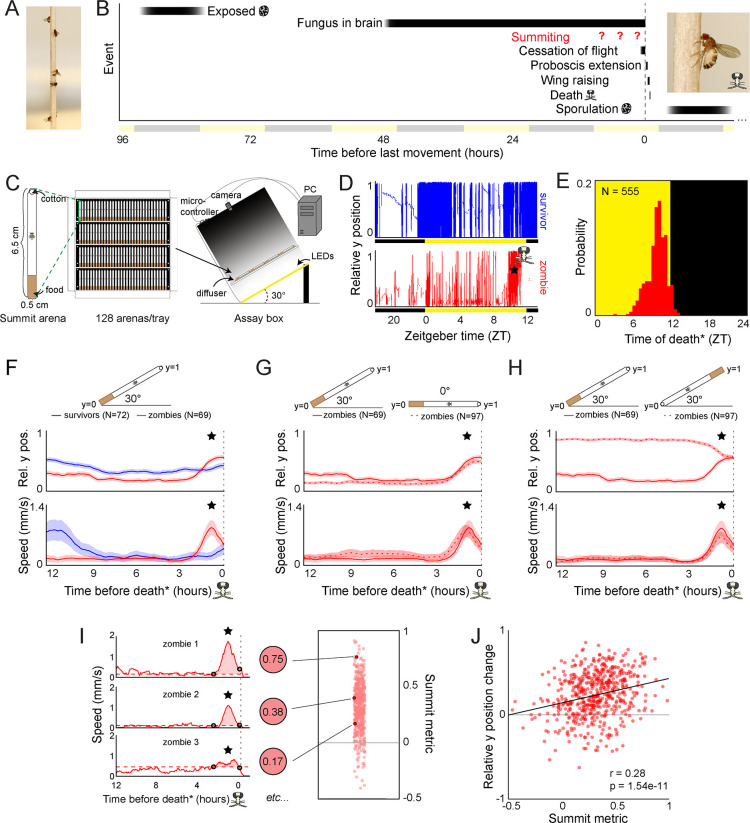
Figure 1. Behavioral signature of E.muscae-induced summiting in wild-type flies.

(A) E. muscae-killed fruit flies that summited on a wooden dowel prior to death. (B) Timeline of events relative to an E. musace-infected fly’s last movement (dashed line). See (Elya et al., 2018; Krasnoff et al., 1995). (C) Summiting assay schematic. (D) Example y position data for a typical survivor fly (top) and zombie (bottom). X-axis is Zeitgeber time (ZT), hours since lights were turned on. The fly ‘skull’ indicates the manually-annotated time of zombie death (see Methods). Black and yellow bars indicate the state of visible illumination. (E) Distribution of time of death for Canton-S flies killed by E. muscae. Background color indicates the state of visible illumination. (F) Mean y position (middle) and mean speed (bottom) of survivor flies (blue) and zombie flies (red) housed in arenas angled at 30° with food at the bottom (schematic at top) during the 12 hr preceding the time of death. Here and in all other panels, shaded regions are +/− 1 standard error of the mean. Time of death for zombies was manually determined as the time of the last movement from the y position trace. Survivors did not die but were assigned fictive times of death from the distribution of zombie death times for comparability (see Methods). (G) As in (F), but comparing zombies in standard arenas (30° with respect to gravity, same data as (F); solid lines) to zombies in flat arenas (0°; dashed lines). (H) As in (F) and (G), but comparing zombies in standard arenas (food at the bottom, same data as (F); solid lines) to zombies in arenas with food at the top (dashed lines). (I) Speed versus time for three examples Canton-S zombies (left) and their corresponding summit metrics (middle) outlined in black (right) amidst all Canton-S summit metrics (N=555, right). Black circles denote the window of summiting behavior as determined from the mean behavior of Canton-S zombie flies. Dashed red line indicates the mean speed in the hour preceding summiting (baseline speed). Summit metric is calculated as the integral of speed minus baseline in the summiting window (shaded region). (J) Relative y position change versus summit metric for Canton-S zombies (N=555). Points are individual flies. Linear regression line in black; Pearson’s correlation r & p-value (upper left).

Figure 1.

Figure 1—figure supplement 1. E.muscae-infected flies die at specific times of day in the absence of proximal lighting cues.
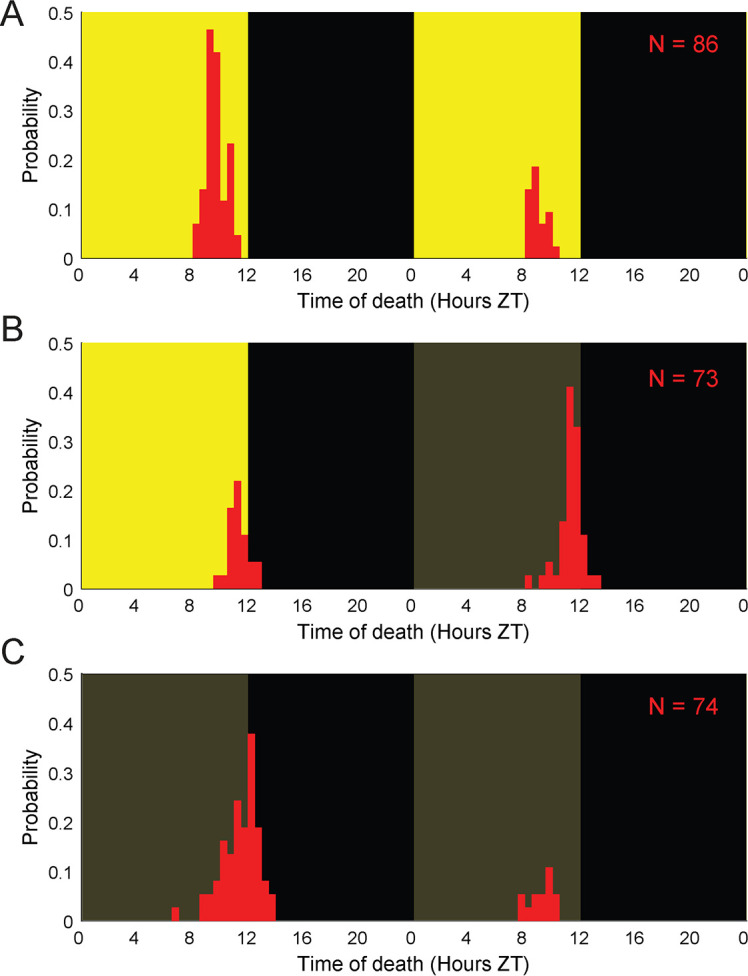
Figure 1—figure supplement 1.

Distributions of time of death for Canton-S flies killed by E. muscae with (A) continuous L:D cues, (B) L:D cues terminating after 96 hr, or (C) L:D cues terminating after 72 hr. Background color indicates state of visible illumination (black or gray = no light; yellow = light; gray = entrainment conditions). Time of death for zombies was manually determined as the time of the last movement from the y position trace. Number of total cadavers observed in each panel is indicated in top right.
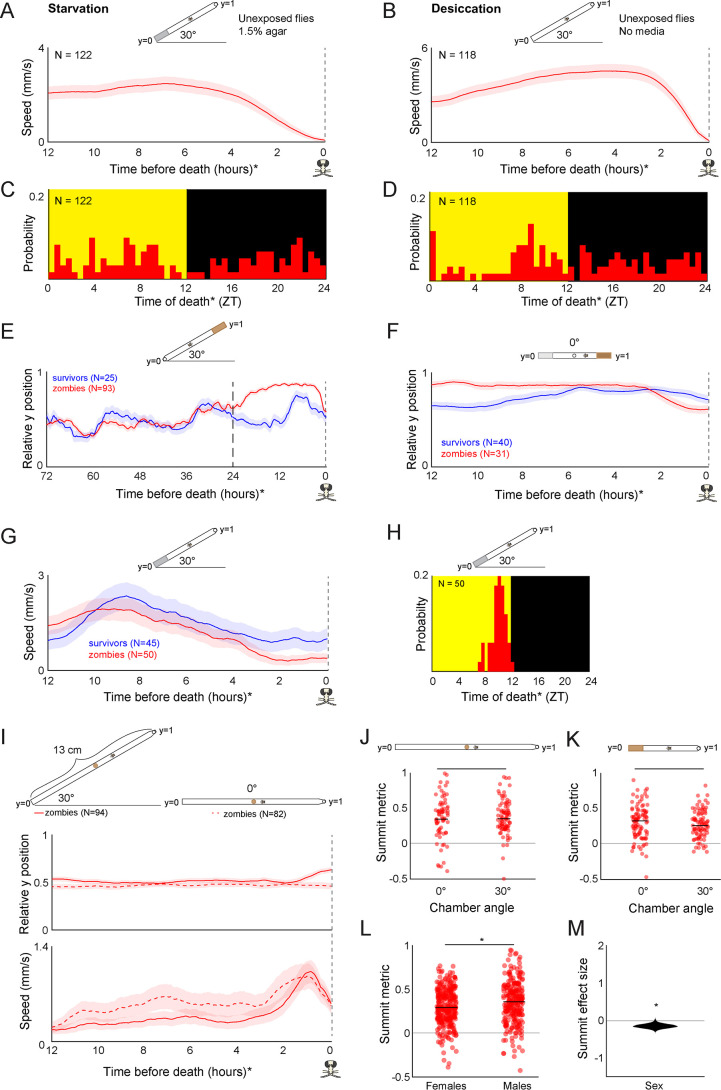
Figure 1—figure supplement 2. Additional features of summiting behavior in the custom behavior assay.

Figure 1—figure supplement 2.

(A) Unexposed, wild-type flies that die of starvation do not exhibit a burst in activity beginning 2.5 hr prior to their last movement, and (C) do not exhibit specific circadian timing of death. Flies in this experiment were provided with non-nutritive agar instead of food at position y = 0. (B) Unexposed, wild-type flies that die of desiccation do not exhibit a burst in locomotor activity beginning 2.5 hr prior to their last movement, and (D) do not exhibit specific circadian timing of death. Flies in this experiment were provided food nor agar at position y = 0. (E) Mean y position of zombie flies diverges from survivors beginning around 24 hr prior to death when nutritive food is positioned at y = 1. (F) Compared to survivors, zombie flies prefer nutritive (5% sucrose, 1.5% agar) over non-nutritive (0% sucrose, 1.5% agar) media in their final 12 hours of life prior to the onset of summiting at 2.5 hours before death. (G) Zombie flies housed on non-nutritive food for their final 24 hr do not exhibit summiting behavior and (H) show typical timing of last death (compare to Figure 1E). (I) When housed in tall arenas (13 cm) with food placed in the middle, zombie flies tend to move slightly upward when the arena is tilted at 30°, but not 0°. Zombies in arenas at both angles exhibit a burst of speed prior to death (bottom). (J, K) Summit metric (see Figure 1I) does not vary for zombies housed in chambers at 0° versus 30° in tall or standard chambers. (L) Summit metric for female versus male Canton-S zombies. (M) Distribution of estimated effect size of sex on summiting. For (A, B, E-K), diagrams depicting behavior arena setup are shown above corresponding plots. For L and M, behavior arenas were in standard configuration (as in Figure 1F)* = p<0.05; **=p<0.01; *** p<0.001 by two-tailed t-test.