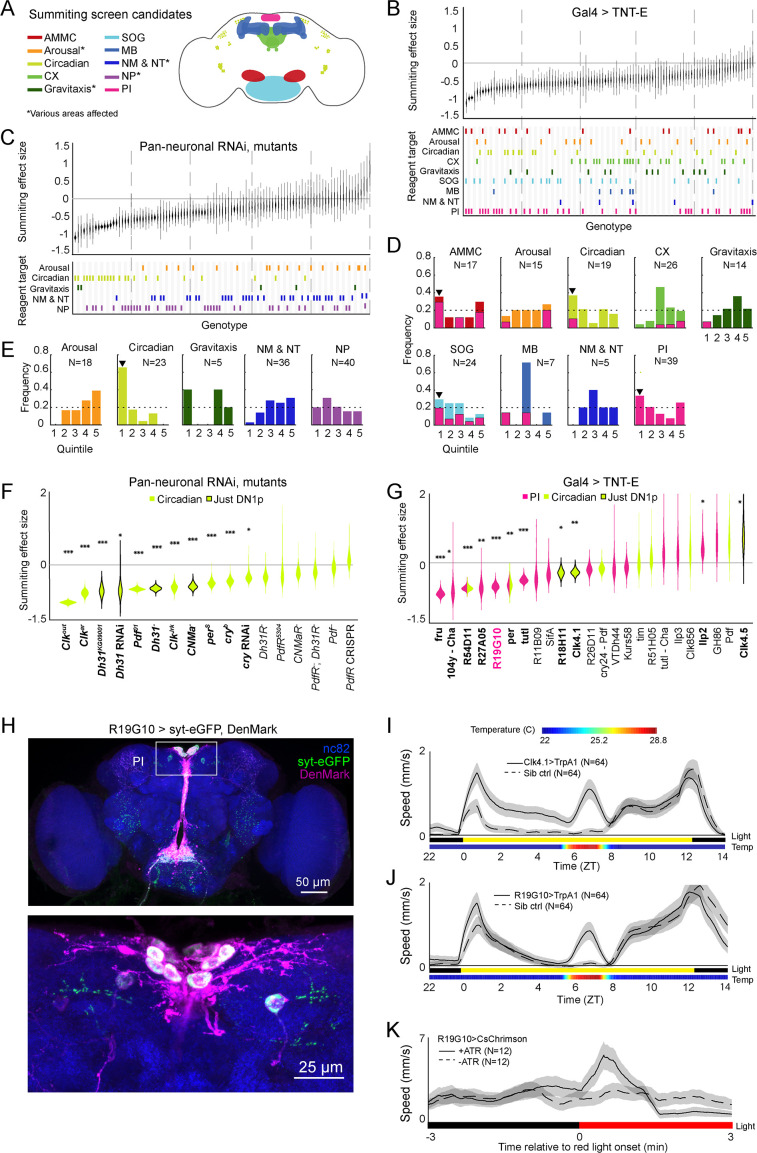
Figure 2. Identification of host circuits and genetic components involved in summiting behavior.
(A) Regions and pathways targeted in the candidate screen. AMMC = antennal mechanosensory and motor center; CX = central complex; SOG = subesophageal ganglion; MB = mushroom body; NM & NT = neuromodulator or neurotransmitter; NP = neuropeptide; PI = pars intercerebralis. (B and C) Effects of neuronal disruption (B; 12<N<111, median N=35) or gene knockdown or mutagenesis (C; 10<N<182, median N=46) on summiting. Above: Summiting effect size estimate distributions as estimated by bootstrapping. Experimental groups are ordered by mean effect (negative to positive). Below: gene function and brain region annotations associated with each screened reagent. See Supplementary file 1 for genotype and annotation details. Solid gray line indicates an effect size of zero. Dashed vertical lines separate ranked data into quintiles. (D and E) Frequency of annotations by quintile for (B) and (C), respectively. The number of lines screened (N) is indicated for each annotation. Dashed line indicates the frequency of annotation expected from a null, uniform distribution. Black arrowheads highlight annotations that are overrepresented in the first quintile. For (D), pink overlays indicate the portion of line annotations that are co-annotated for expression in the PI. (F and G) Summiting effect size estimate distributions of disrupting specific circadian genes (F; 19<N<182, median N=62) or circadian and/or PI neurons (G; 11<N<111, median N=46) compared to genotype-matched controls. Lines are ordered by effect size. Pink indicates Gal4 expression in the PI, lime circadian Gal4 lines and genes, and black outlines expression only in DN1ps. Asterisks indicate statistically significant effects on summiting behavior by a two-tailed t-test (*=p<0.05; **=p<0.01; *** p<0.001). R19G10 is highlighted in pink to emphasize its subsequent use as the main PI reagent. See Supplementary file 2 for genotypes and matched controls. (H) Maximum z-projections of brains showing pre- (synaptotagmin; syt-eGFP) and post- (DenMark) synaptic compartments of R19G10 neurons. Bruchpilot (nc-82) staining (blue) visualizes neuropil. Above: brain imaged from anterior. Below: another brain, imaged from the posterior. (I and J) Mean speed of unexposed flies vs time for Clk4.1>TrpA1 and R19G10>TrpA1 genotypes and sibling controls, respectively. Shaded regions are +/− 1 standard error of the mean. Bars along the x-axis indicate the state of visible illumination (above) and temperature (below). (K) Red light onset-triggered mean speed across flies of unexposed R19G10>CsChrimson flies versus time. All trans retinal (ATR) indicates control flies not fed CsChrimson cofactor. Shaded regions are +/− 1 standard error of the mean. Bar along the x-axis indicates lighting conditions (black: darkness, red: red-light illumination).


