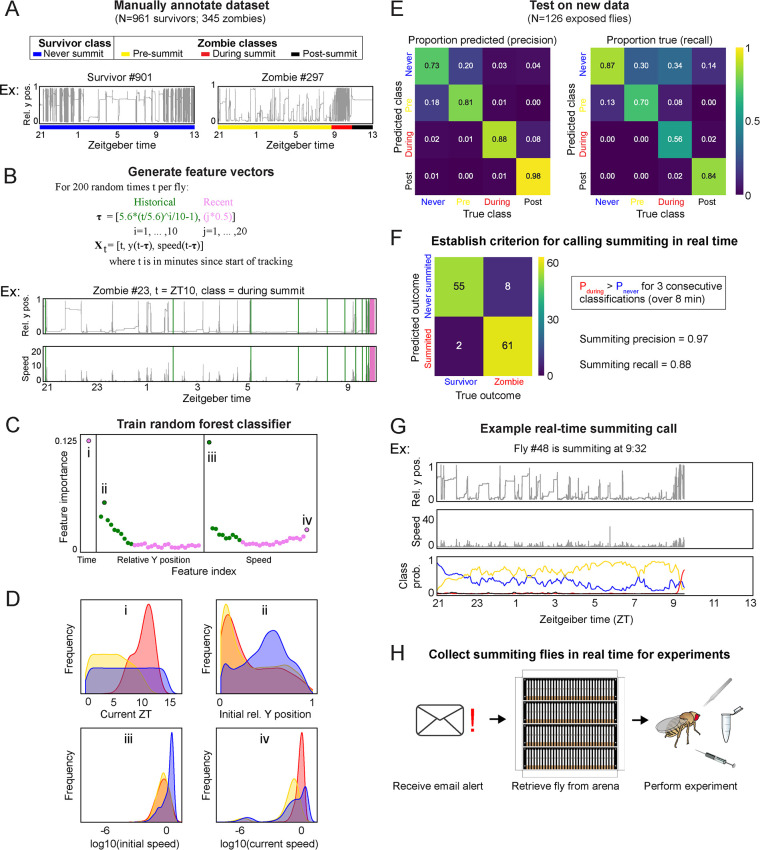
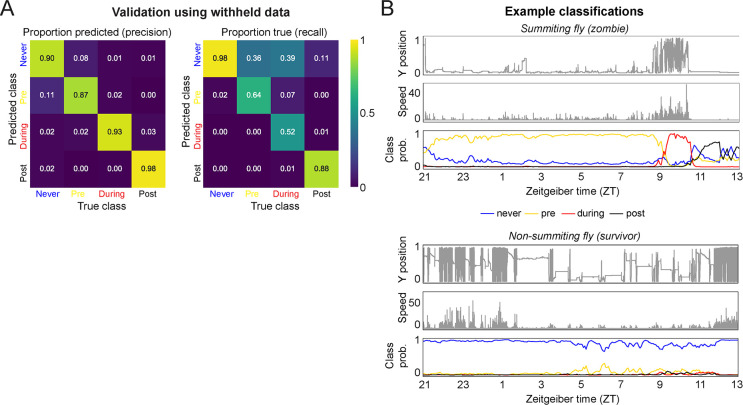
Figure 4. A random-forest classifier (RFC) for identifying summiting flies in real-time.
(A) Top: classes learned by the classifier for zombies were pre-summiting=prior to the onset of summiting (yellow), during summiting = after the onset of summiting but before the time of death (red), and post-summiting=after the time of death (black). For survivors, there was one class, never-summiting (blue). Bottom: annotations of these classes on example y position trajectories from a survivor (left) and zombie (right). (B) Feature vectors (Xt) generated for 200 random time points (t) for each fly. Vertical green and pink lines in the example trajectory below indicate the historical (green) and recent (pink) values selected for the feature vector. (C) Feature importance for classification of the 61 input variables. Roman numerals correspond to plots in subsequent panels. (D) Distributions of important feature variables, visualized with kernel density estimation, across never summiting (blue), pre-summiting (yellow), and summiting (red) classes within the training dataset. (E) Confusion matrices for precision (left) and recall (right) performance of the classifier on the test dataset. (F) Confusion matrix for the survivor and zombie outcomes after implementing the real-time zombie-calling criterion. (G) Example real-time behavior and class probability trajectories for a zombie fly, ending on the frame when it was called as a zombie. (H) Summarized experimental workflow using the real-time classifier.


