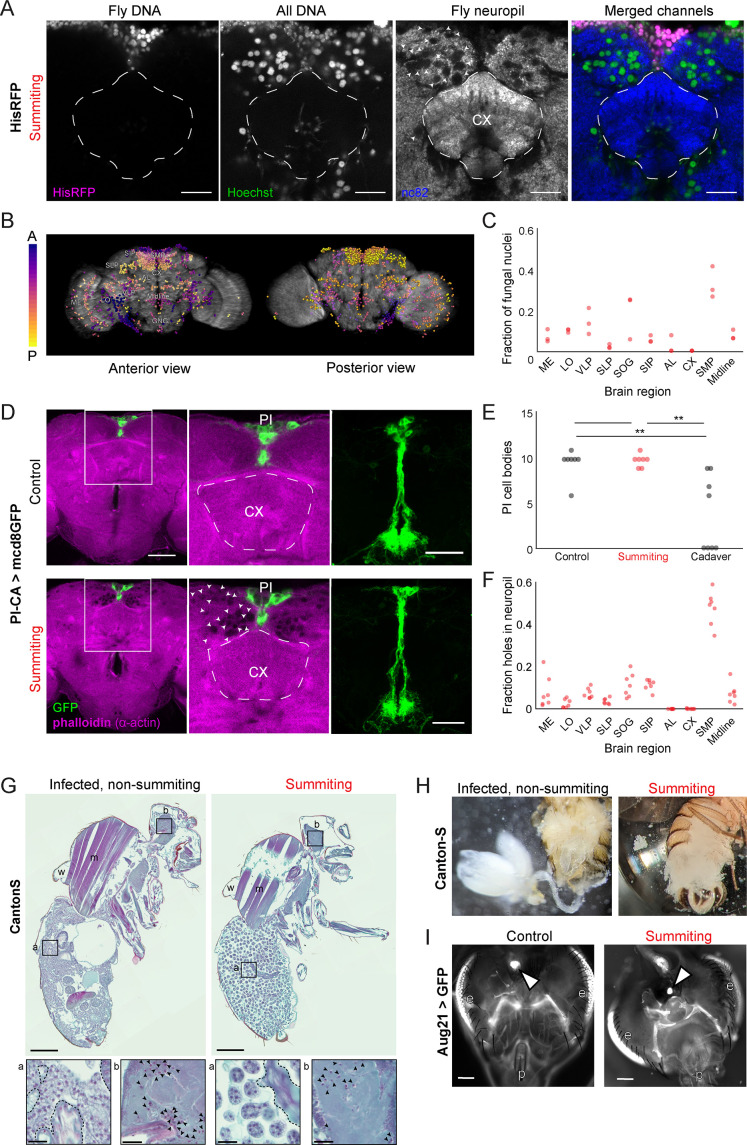
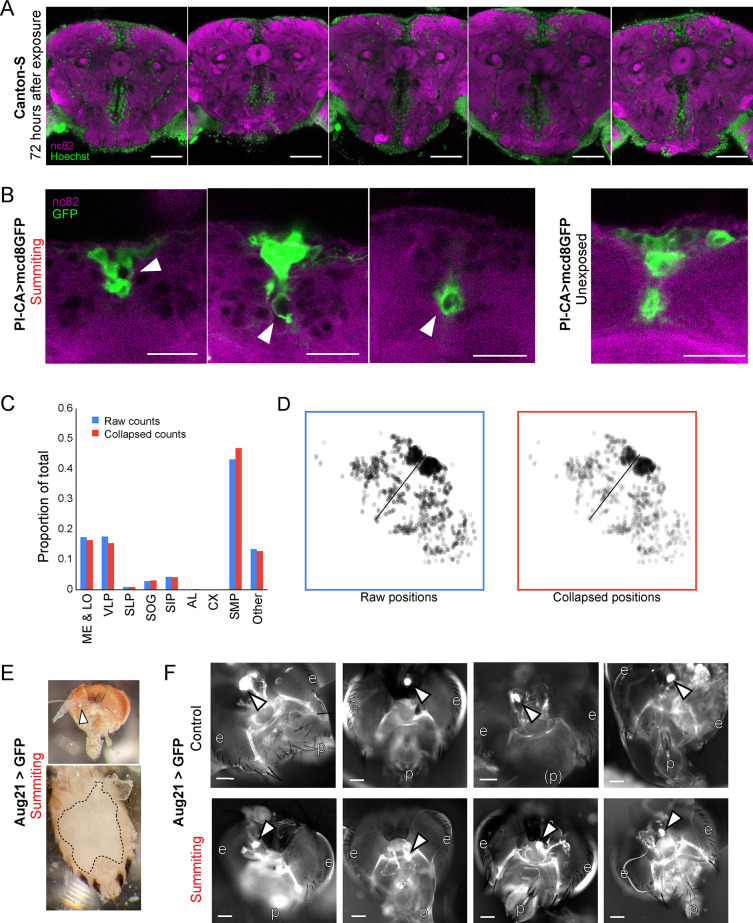
Figure 5. E.muscae densely occupies the superior medial protocerebrum (SMP) during summiting without apparent degradation of pars intercerebralis to corpora allata (PI-CA) neurons or corpora allata (CA).
(A) Confocal micrographs of the superior medial protocerebrum (SMP) from summiting His-RFP fly. Non-fly nuclei (Hoechst+, HisRFP−) are large compared to fly neuronal nuclei (Hoechst+, HisRFP+) and sit in ‘holes’ in the neuropil visible in the nc82 counterstain channel. Scale bar is 20 microns. (B) Whole brain invasion pattern of E. muscae (same brain as A). Nuclei are colored according to depth from anterior (A) to posterior (P). (C) Distribution of fungal nuclei across brain regions (N=3). AL = antennal lobe, SIP = superior intermediate protocerebrum, SLP = superior lateral protocerebrum, CX = central complex, VLP = ventrolateral protocerebrum, SOG = subesophageal ganglion, LO = lobula, ME = medulla, midline = cells along the midline of the brain not in any other region. (D) Confocal micrographs of PI-CA neurons (green) and phalloidin counterstain (magenta) in control and summiting flies. Left: sagittal planes of the central brain. Holes are apparent (in the phalloidin channel) in the SMP of the summiting brain, marked by arrowheads in one hemisphere. Holes are absent in CX of summiting brains and all control brain regions. Middle: Inset from the left. Right: Maximum z-projections of GFP channel from full brain z-stacks. PI-CA morphology appears the same in summiting and control brains. Scale bars are 50 microns. (E) Counts of PI-CA cell bodies in control (unexposed), summiting, or recently-killed (cadaver) PI-CA >mcd8 GFP flies (** indicates p<0.01 by a two-tailed t-test). (F) Distribution of ‘holes’ across brain regions. Abbreviations as in C. (G) Safranin and fast green stained sections of paraffin-embedded Canton-S flies. Left: Infected, non-summiting fly (96 hr after exposure to fungus). Right: summiting, E. muscae-infected fly. a=abdomen, b=brain, w=wing, m=muscle. Scale bars are 200 microns. Insets of the abdomen and brain are shown for each fly below (scale bars are 25 microns). Host tissues are outlined in dashed black; black arrowheads indicate fungal nuclei. (H) Micrographs of dissected abdomens of 96-hour post-exposure non-summiting (left) and summiting (right) female flies. Gut and reproductive organs are still present in the non-summiting fly, but are absent in the summiting fly. Clumps of spherical fungal cells are visible in the dissection saline of summiting but not non-summiting fly. (I) Fluorescence images of dissected Aug21 >GFP flies. White arrowheads indicate CA. p=proboscis, e=eyes. Scale bars are 100 microns. Additional examples are available in Figure 5—figure supplement 1F.


