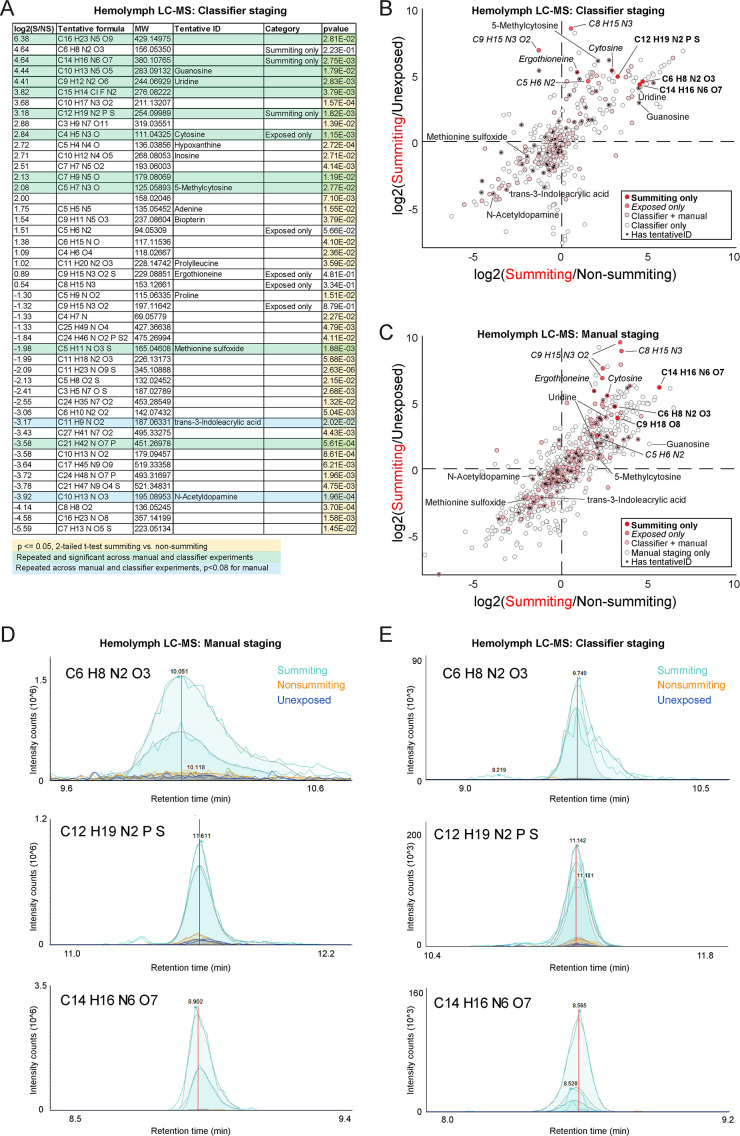
(A) Compounds of interest from classifier-staged metabolomics experiment. Compounds are included if at least one of three conditions is met: (1) they are significantly different between summiting and non-summiting, exposed animals, and exhibit at least a twofold change between these treatments, (2) they were only detected in summiting flies (‘Summiting only’), or (3) they were only detected in exposed flies (‘Exposed only’; summiting or non-summiting), but not unexposed flies. p-values <0.05 are highlighted in yellow. Compounds highlighted in green were observed to be significantly different between summiting and non-summiting flies in both the manual and classifier-based experiments (p< = 0.05 by a two-tailed t-test); compounds in blue were significant in the classifier-staged experiment and fell just short of significant (p<0.08) in the manual experiment. (B) Scatter plot of the log2-fold-change of compound abundance in summiting compared to unexposed flies versus the log2-fold-change of compound abundance in summiting compared to exposed, non-summiting flies. Data from the classifier-staged experiment. Compounds in the darkest red were observed only to have chromatogram peaks above baseline (1e3 intensity counts) in summiting samples and not in any other samples. Compounds in medium red were only observed to have real peaks in exposed (summiting or non-summiting) but not unexposed samples across both experiments. Compounds in light red were observed in all experimental groups of both experiments (molecular weight within five parts per million between experiments). Compounds in white were observed in the classifier-based experiment but were not observed in the manually-staged experiment (absolute difference in molecular weight greater than five ppm). Compounds that were observed in both experiments, showed significant differences between summiting and non-summiting flies, and were tentatively identified, are labeled with the compound name or molecular formula. (C) As in (B), for the manually staged experiment. (D,E) Raw chromatogram peaks for three compounds assessed to only be present in summiting flies in manually-staged (D) and classifier-staged (E) metabolomics experiments. Different peaks of the same color are biological replicates. Putative formulas as determined from the measured mass given in the upper left corner for each plot.
Figure 6—figure supplement 2—source data 1. Compounds over- or under-abundant in the hemolymph of summiting flies from classifier-staged metabolomics experiment.


