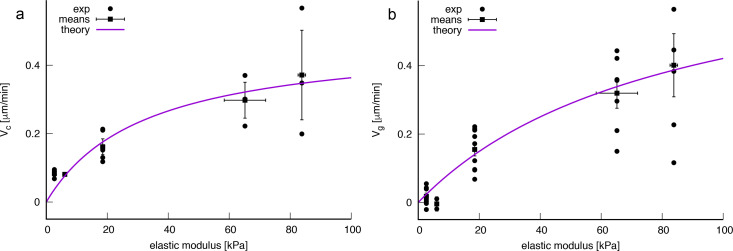
Appendix 1—figure 1. Experimentally measured velocity vs rigidity data and least squared fits of Equation A11 w.r.t. to the experimental values as indicated in the legends.
(a) Local velocity measures. Parameters obtained by a least-square fit: kPa, μm.min-1. (b) Global velocity measures. Parameters obtained by a least square fit: kPa, μm.min-1. Errorbars indicate SEM.

