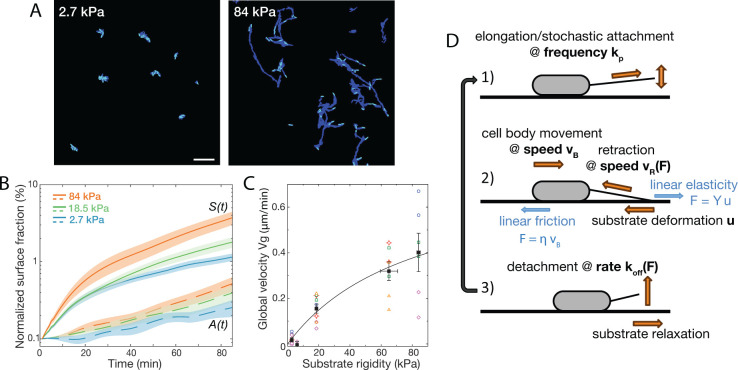
Figure 2. Bacterial surface motility is impaired on soft hydrogels.
(A) Surface explored (dark blue) and current surface coverage (cyan) after 100 min on soft and stiff PAA surfaces. Scale bar: 20 μm. (B) Surface coverage A(t) (broken lines) and cumulative explored area S(t) (full lines) for all tested rigidities (the initial surface coverage was normalized to 0.1%). Shaded areas are standard errors of the mean (84 kPa: 6 data sets from independent experiments, 18.5 kPa: 10 data sets from five independent experiments, 2.7 kPa: 8 data sets from independent experiments).(C) Global bacterial motility averaged over the first 100 min, inferred from the difference between A(t) and S(t) (16 different surfaces, 6 independent experiments). The black line is the fit with the kinetic model using equation A11. with values m.min-1 and kPa. (D) Ingredients of the minimal 1D model for bacterial T4P-powered displacement.


