. 2023 May 9;12:e81112. doi: 10.7554/eLife.81112

Figure 3. Twitching motility depends on substrate rigidity and is highly distributed in the bacterial population.

Analysis of full tracks (top row) and 1 min displacement steps (bottom row). (A) Individual bacterial tracks on soft (2.7  kPa), intermediate (18.5  kPa) and stiff (84  kPa) PAA during the first 3 hours after bacterial inoculation (total number of tracks is respectively 60, 123, and 175). Scale bar: 10 μm (B) Mean track velocity distribution for different values of the substrate rigidity. Only full tracks were considered (corresponding to the right peak in Figure 3—figure supplement 1). 84 kPa: 330 tracks from 2 independent experiments, 18.5 kPa: 394 tracks from 3 independent experiments, 2.7 kPa: 83 tracks from 2 independent experiments. (C) Normalized velocity distributions for the whole bacterial population on different PAA surfaces. The exponential decrease yields a characteristic active velocity VC on each substrate. Displacement steps were measured every minute for 100 min, and two positions were acquired on each rigidity. The average of T4P-defective mutant on all surfaces is shown as a reference. (D) Characteristic active velocity values VC obtained by fitting velocity distributions (6 independent experiments, 16 different surfaces). Values measured on different surfaces in a single experiment (same channel) are shown with the same symbols and connected. Black squares(circled stars) are mean values obtained for the WT(pilA mutant), and error bars show the SEM. The black line is the fit of WT values with the kinetic model-derived equation A11, with Vmax=0.48±0.12 μm.min-1 and E0=32±30 kPa. (E) Average velocity values of the top 5% fastest displacement steps for different substrates. Error bars are standard errors.

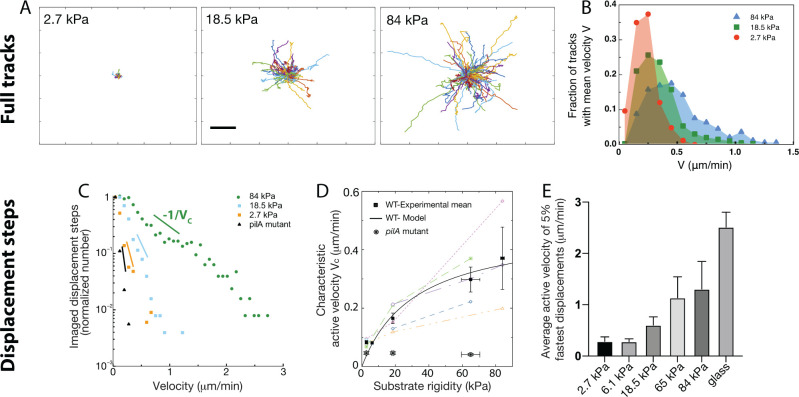
Figure 3—source data 1. Instant velocity values from bacterial tracking.
elife-81112-fig3-data1.xlsx (588.9KB, xlsx)

Figure 3.

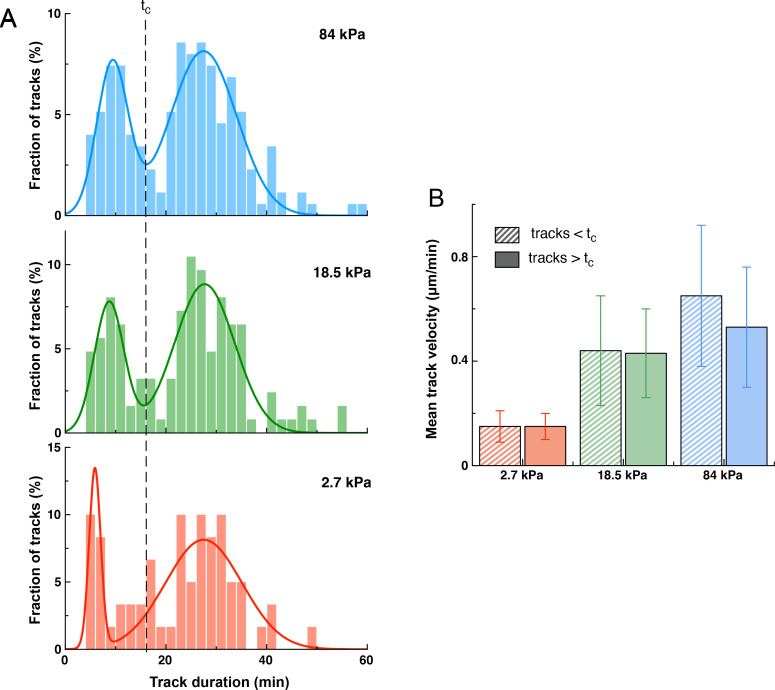
Figure 3—figure supplement 1. Tracking result reveals bacterial sub-populations on hydrogel substrates.

Figure 3—figure supplement 1.

(A) Distribution of the path duration of bacterial tracks measured on different PAA substrates (WT PAO1). One track starts after a division event, and finishes either at the next division, or when the bacterium leaves the surface. Full lines are bimodal gaussian fits, evidencing a sub-population of bacteria that detach from the surface before dividing. (B) Mean track velocity is similar for short tracks (below the cutoff value tc = 16 min) and long tracks, for all tested substrate rigidities. (total number of analyzed tracks: 60 (2.7 kPa), 124 (18.5 kPa), 175 (84 kPa)).
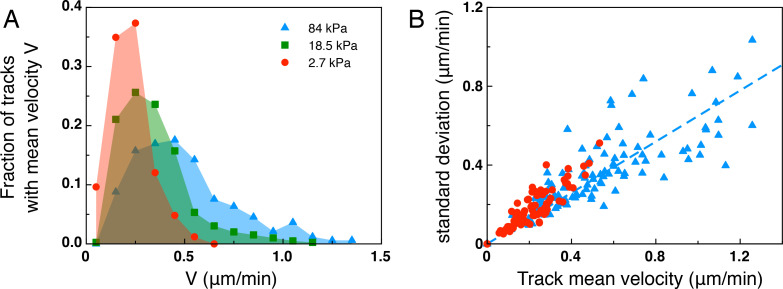
Figure 3—figure supplement 2. Anaysis of the mean track velocity.

Figure 3—figure supplement 2.

(A) Mean track velocity distribution for different values of the substrate rigidity. Only full tracks were considered (corresponding to the right peak in Figure 3—figure supplement 1). Considering all tracks does not significantly modify the distributions (data not shown). 84 kPa: 330 tracks from 2 independent experiments, 18.5 kPa: 394 tracks from 3 independent experiments, 2.7 kPa: 83 tracks from 2 independent experiments. (B) Standard deviation of the mean velocity for individual tracks, shown for the 2.7 kPa and 84 kPa data sets. Dotted line is a linear fit for the 84 kPa data (y=0.65x).
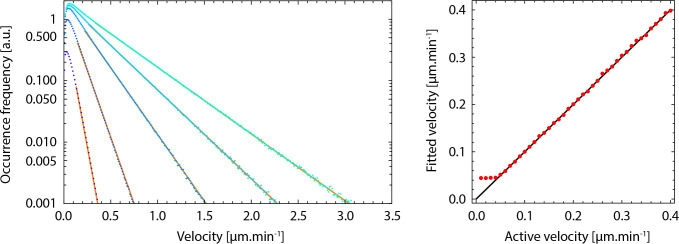
Figure 3—figure supplement 3. Validation of the fitting of displacement steps distributions with single exponentials.

Figure 3—figure supplement 3.

Left, calculated distributions (dots) of the sum of two uncorrelated random vectors each following a decreasing exponential distribution with characteristic velocities VC and VC,p, at an angle following a random distribution. VC,p=0.044μm/min is equal to the experimentally measured value on the pilA mutant. VC spans a range similar to experimental measurements, (0.05, 0.1, 0.2, 0.3, and 0.4 μm/min, from dark blue to cyan). Orange lines are exponential functions with the corresponding. VC Right, characteristic velocities extracted by fitting the exponential part of the simulated distributions, as a function V_C, with. VC,p=0.044μm/min The black line corresponds to y=x.
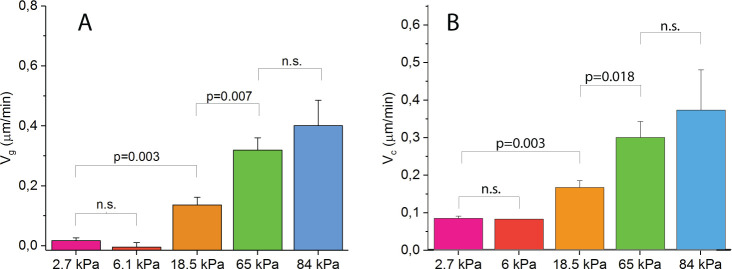
Figure 3—figure supplement 4. Statistical analysis of Vg (A) and Vc (B) for various gel rigidities.

Figure 3—figure supplement 4.

Indicated are p-values from paired two-sided Mann-Whitney non-parametric tests. n.s. denotes datasets that are not significantly different at a threshold of 0.05.
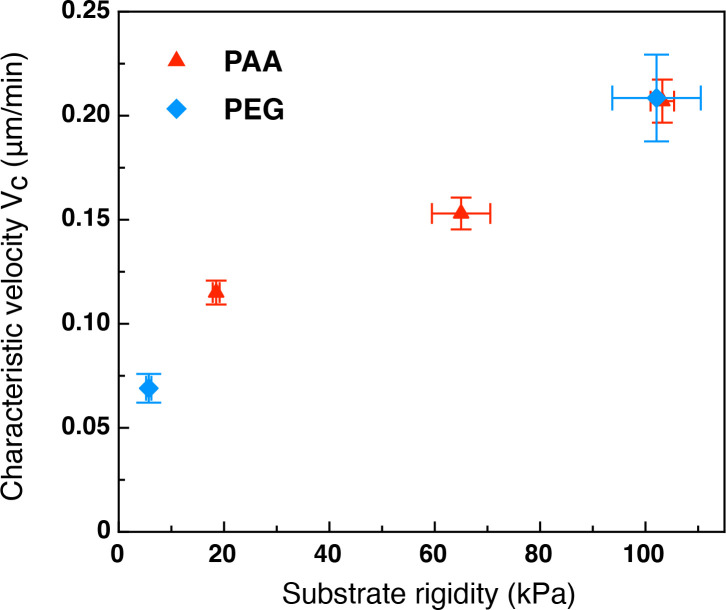
Figure 3—figure supplement 5. Characteristic twitching velocity measured on PEG hydrogels is similar to the one measured on PAA hydrogels under identical experimental conditions.

Figure 3—figure supplement 5.

VC obtained by fitting the distribution of displacement steps on PAA or PEG hydrogels in a similar range of substrate rigidity. Error bars are SEM. Each point is the average of 2 positions from 1 experiment. (Note that for technical reasons these experiments were carried out with a wall shear stress of 6.4 mPa, about 3x higher than all other experiments on PAA).