. 2023 May 9;12:e81112. doi: 10.7554/eLife.81112

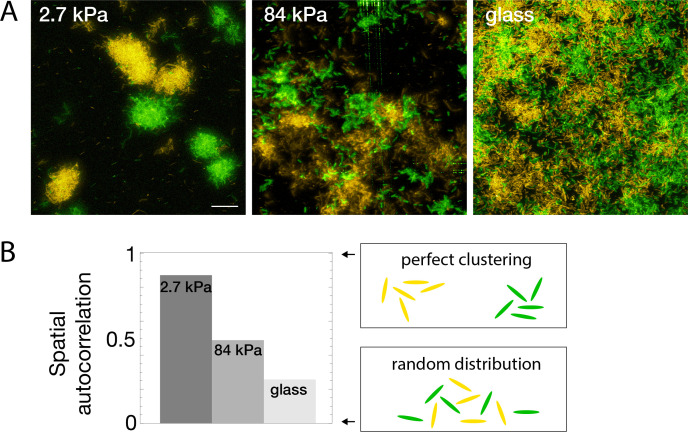
Figure 5. Bacterial spatial distribution is impacted by substrate rigidity.

(A) Images of surfaces seeded with a 1:1 mixture of constitutively fluorescent bacteria expressing GFP or YFP show mostly monoclonal colonies on soft hydrogels, and mixed bacteria on rigid substrates (3D-rendering obtained by stacking images). Scale bar, 20 μm.(B) Spatial correlations quantified via Moran’s I index.

Figure 5.

Figure 5—figure supplement 1. Bacterial spatial distribution as a function of substrate rigidity.
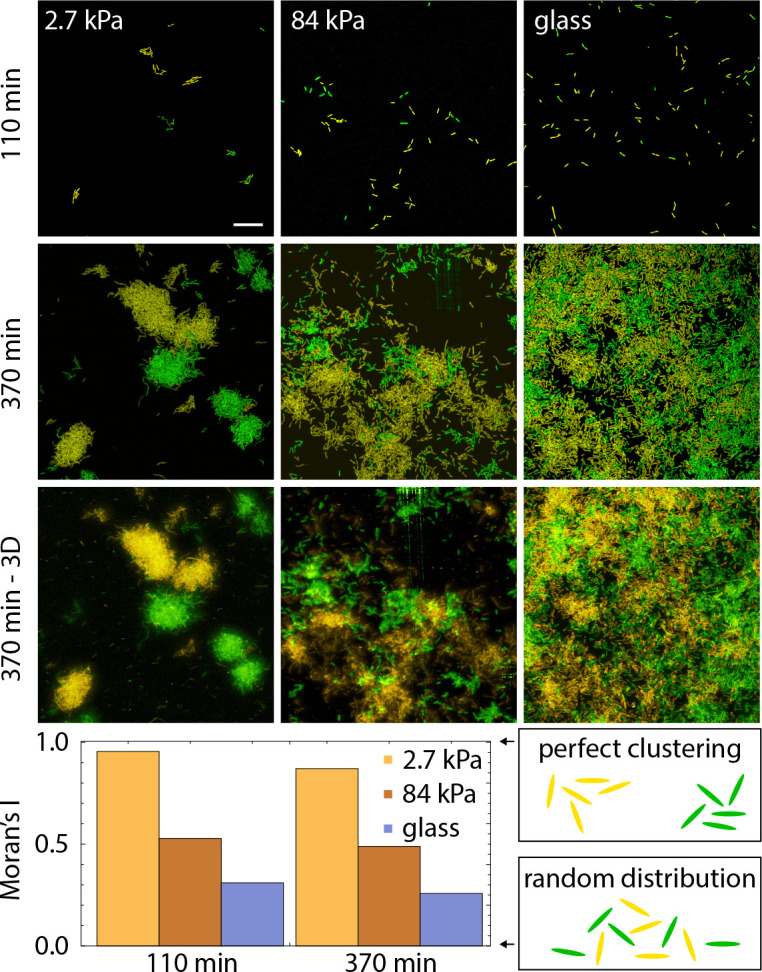
Figure 5—figure supplement 1.

Top, images of surfaces seeded with a 1:1 mixture of constitutively fluorescent bacteria expressing GFP or YFP at two different times after the start of surface colonization (bottom : 3D rendering of a volumetric image). Bottom, Spatial autocorrelation quantified via Moran’s I index at the two time points il lustrated above. The values should not be directly compared between the two time points (see SI I-C) but illustrate that the rigidity modulation of mixing is maintained over time from very sparse to large coverage of the surface.