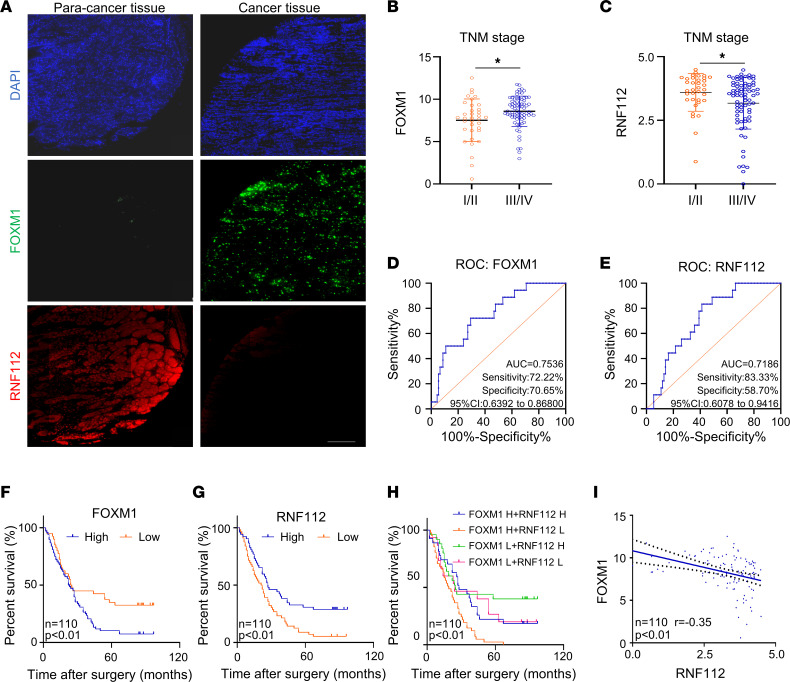
Figure 8. FOXM1 exhibits inverse correlation with RNF112 in gastric cancer tissues.
(A) Representative multicolor immunofluorescence pictures of FOXM1 and RNF112 in gastric cancer tissues and the corresponding normal tissues. Scale bar: 200 μm. (B and C) The association between the expression of FOXM1 (B) or RNF112 (C) and TNM stages in patients with gastric cancer (n = 110). (D and E) The ROC curves for determining the cutoff values of survival analysis of FOXM1 (D) and RNF112 (E). (F–H) Kaplan-Meier survival analysis according to the expression of FOXM1 (F) or RNF112 (G) alone, or the combination of the above 2 indices (H) (n = 110). (I) Correlation of the expression levels between FOXM1 and RNF112 in the gastric cancer tissues (n = 110). Data are presented as mean ± SD. Statistical significance was calculated using Mann-Whitney U test (B and C), log-rank test (F–H), or Pearson’s test (I). *P < 0.05.

