Figure 1.
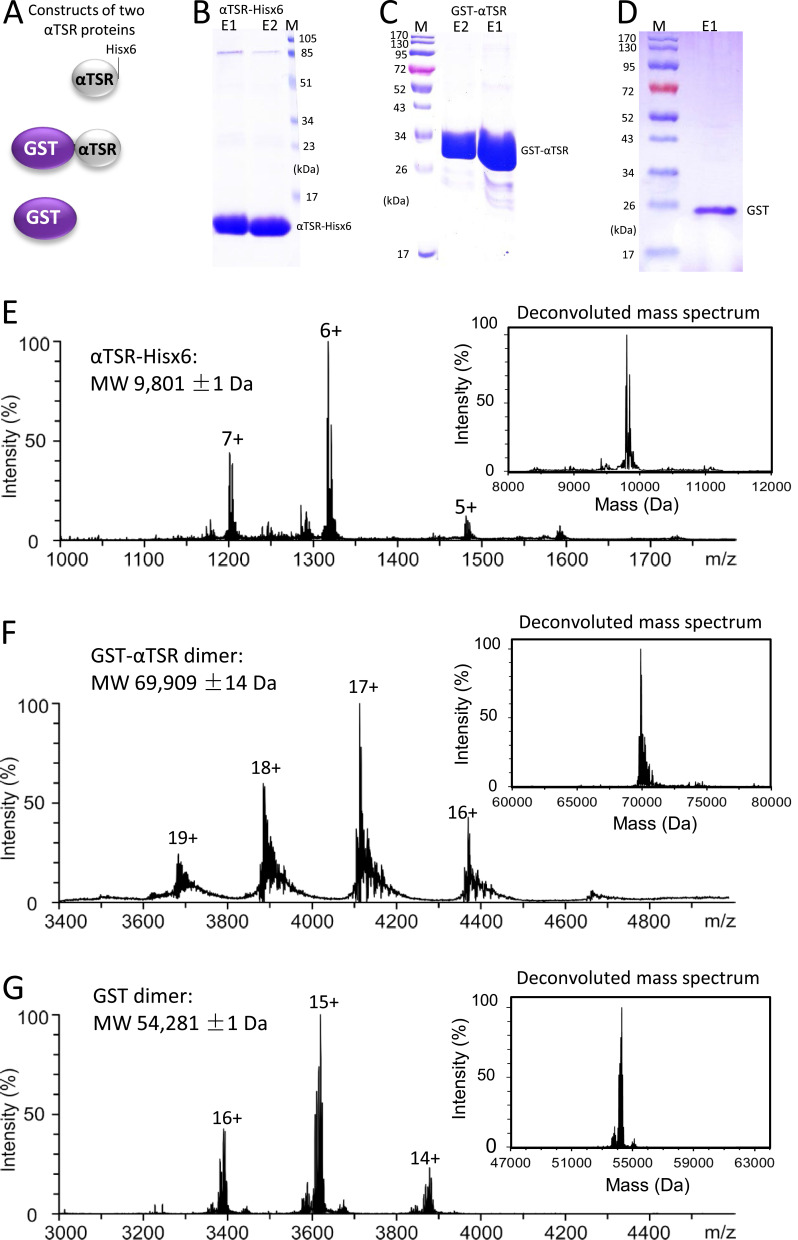
Generation and characterization of two αTSR proteins. (A) Schematic constructs of the αTSR-Hisx6 (top panel), the GST-αTSR (middle panel), and the GST (bottom panel) proteins. (B–D) SDS-PAGE showing the purified αTSR-Hisx6 protein at ~10 kDa (B), the GST-αTSR protein at ~35 kDa (C), and the GST at ~26 kDa (D), respectively. Lanes E1 and/or E2 are elution fractions from the purification resin. M is protein markers with indicated molecular weights. 16% gel was used in (B), whereas 10% gels were used for (C and D). (E–G) Molecular weight (MW) determinations of the αTSR-Hisx6 (E), GST-αTSR (F), and GST proteins by electrospray ionization (ESI) and corresponding deconvoluted (insets) mass spectra, revealing 9801 Da, and 69,909 Da, and 54,281 Da, respectively.

