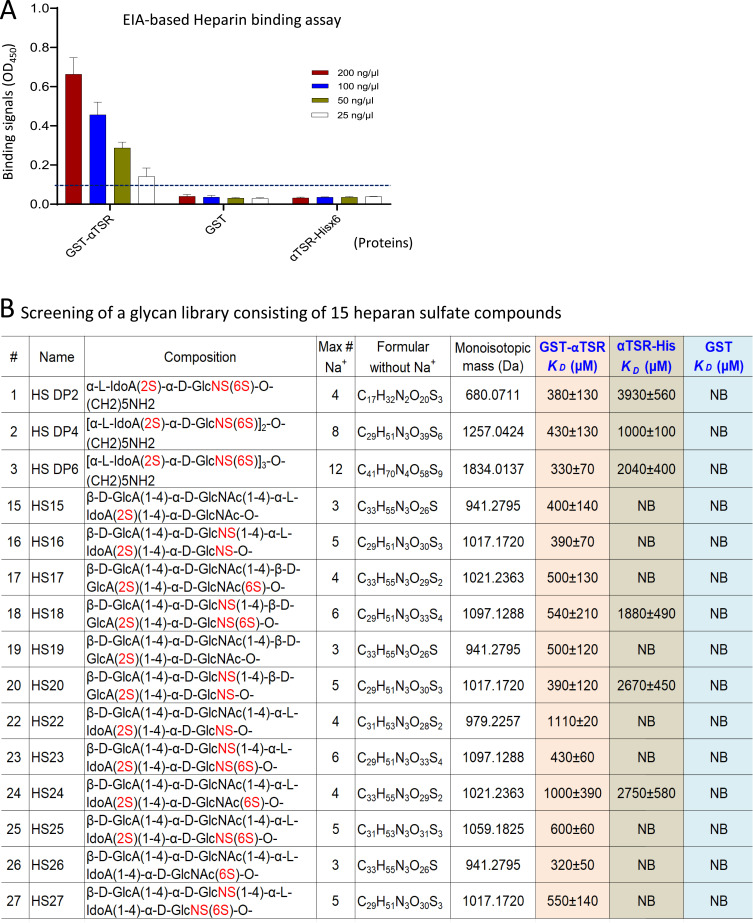
Figure 2.
Binding of the αTSR proteins to heparan sulfate (HS) glycans. (A) Binding of the αTSR containing proteins to heparin sodium salt by EIA based binding assays. Y-axis shows binding signals in optical density (OD450), while X-axis denotes the proteins at indicated concentrations: red columns, 200 ng/µL; blue columns, 100 ng/µL; brown columns, 50 ng/µL; and while columns, 250 ng/µL. The cutoff signal value (OD450=0.1) is shown by a dashed line. (B) Screening of a HS glycan library consisting of 15 HS glycans using the αTSR-Hisx6, the GST-αTSR, and GST (indicated by blue fonts) as probes, respectively, through electrospray ionization mass spectrometry (ESI-MS). The order (#), name, composition, maximum number of sodium (Max # Na+), formula without sodium (Na+), and monoisotopic mass (Da) of each HS glycan, as well as their binding affinities in dissociation constants (KD, µM) to each of the GST-αTSR, the αTSR-Hisx6, or GST protein are shown. In the composition column, the numbers of sulfates are shown in red fonts. The KD is an average value (µM) ± standard deviation. NB ≡ no binding.

