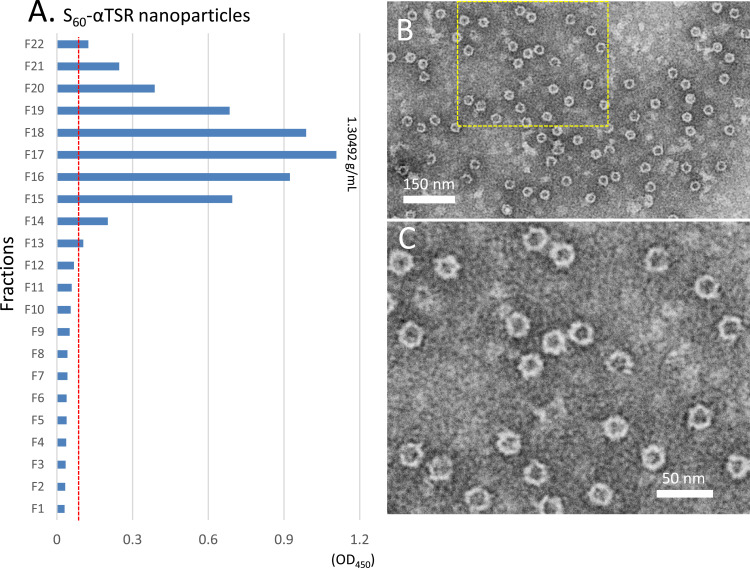
Figure 4.
Analysis of the S60-αTSR nanoparticles after purification by cesium chloride (CsCl) density gradient centrifugation. (A) Following centrifugation, the CsCl density gradient containing the S60-αTSR nanoparticles was fractionated into 22 portions. The relative concentrations of the S60-αTSR protein in the fractions were measured by EIA assays using antibody against norovirus VLP. Y-axis indicates the fraction numbers, while X-axis shows signal intensities in optical density (OD450) with a red dashed line showing the cut-off signal at OD450=0.1. (B and C) A TEM micrograph of the S-αTSR protein of fraction 17 showing uniform S60-αTSR nanoparticles (B) with an enlargement of the framed area in (C) showing recognizable protrusions of αTSR antigens on the surface.

