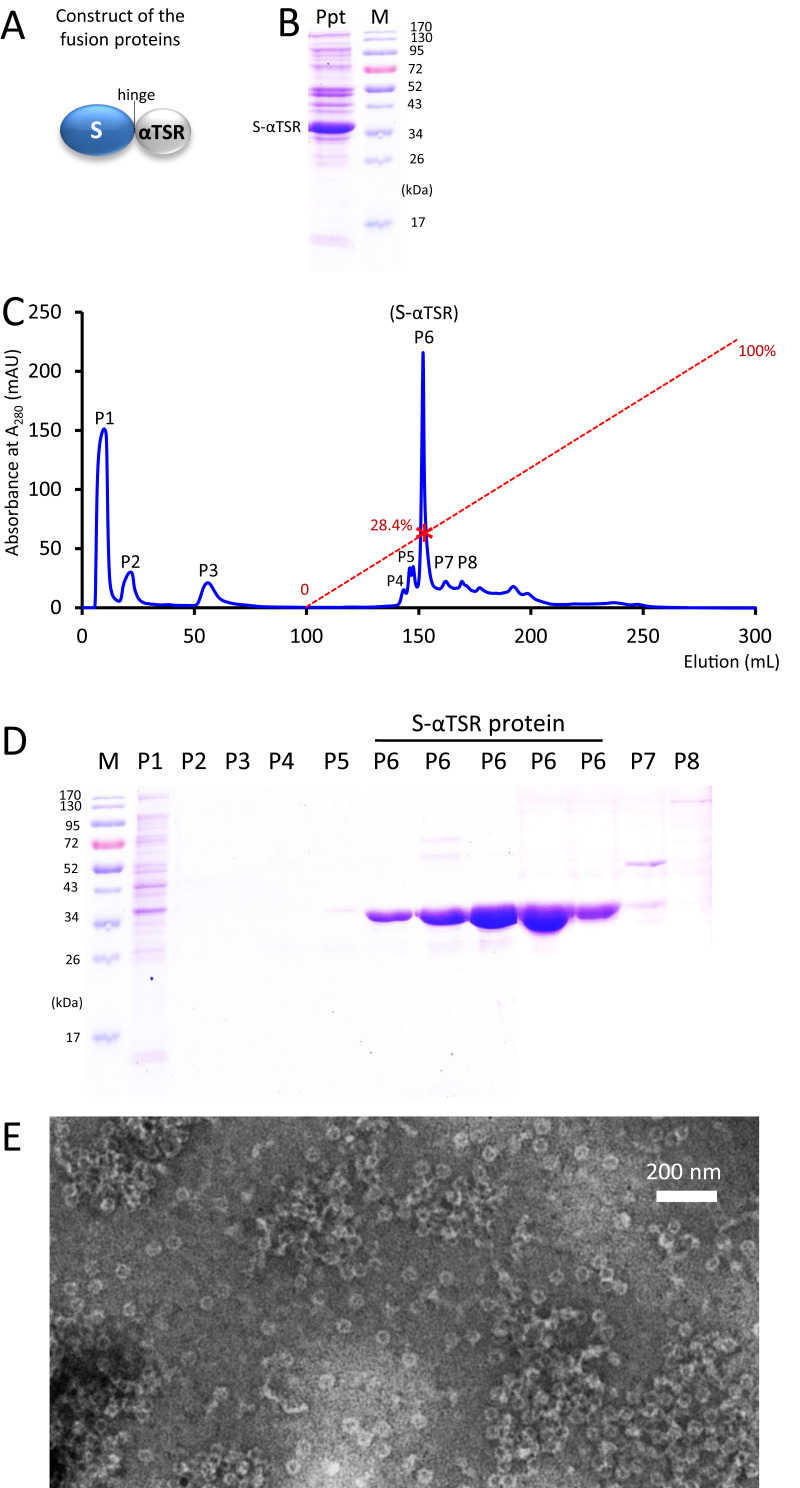
Figure 5.
Production of tag-free S60-αTSR nanoparticles. (A) The schematic construct of the tag-free S-αTSR proteins. (B) SDS-PAGE showing the ammonium sulfate precipitated S-αTSR protein (Ppt) from the bacterial lysis. (C) An anion exchange elution curve of the ammonium sulfate precipitated proteins from (B). Y-axis shows UV absorbances at A280 (mAU), whereas X-axis indicates elusion volume (mL). The red dashed line indicates the linear increase of the elution buffer B (0–100%) with a red star symbol indicating the percentage of buffer B at the elution position of the S-αTSR protein (28.4%). Eight elution peaks (P1 to P8) that were analyzed by SDS-PAGE are indicated. (D) SDS-PAGE analyses of the eight elution peaks from the ion exchange (C). Five fractions from P6 were analyzed. M in (B and D) is protein standard with the molecular weights as indicated. The S-αTSR protein is eluted in P6. (E) A micrograph of transmission electron microscopy (TEM) of the protein sample from P6 showing typical S60-αTSR nanoparticles.

