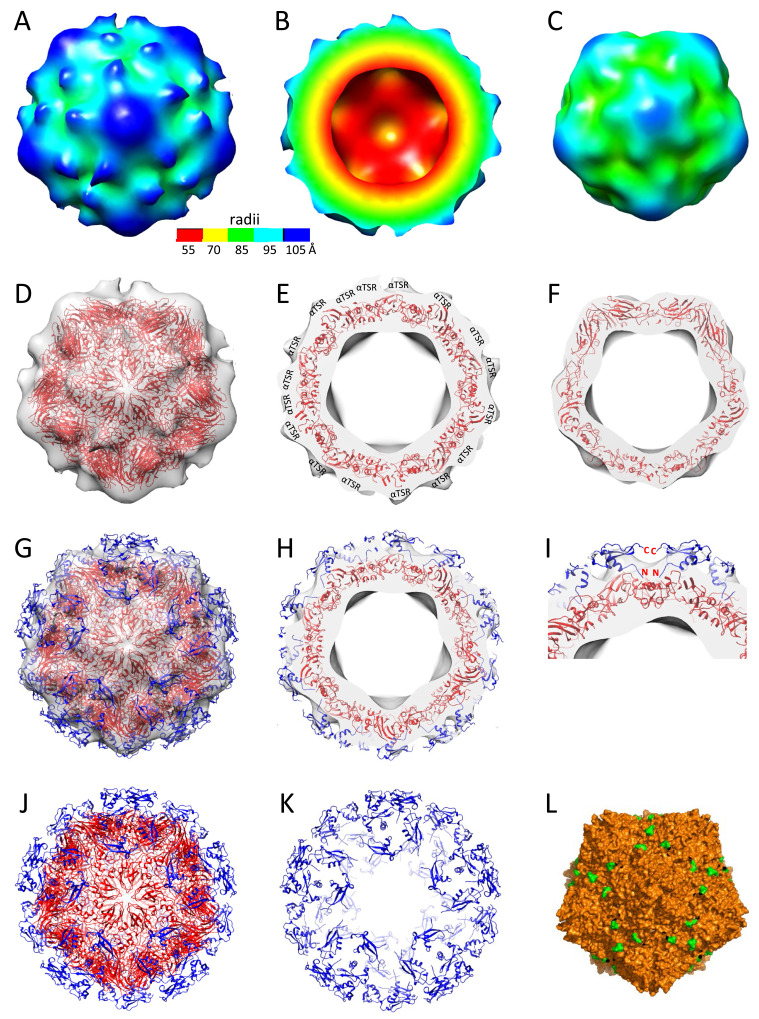
Figure 6.
3D structures of the S60-αTSR nanoparticle. (A to (C) The S60-αTSR nanoparticle in surface view (A) showing its external structure; section view (B) showing its cross section, internal lumen, and interior structure, as well as surface view (C) of the S60 inner shell, respectively, revealing a T = 1 icosahedral symmetry. The colored bar shows the radii of the structures in different color schemes. (D–F) Fitting of a GII.4 norovirus S60 nanoparticle model (strain VA387, red cartoon representation) into the electron density map of the S60 shell region, showing in full (D) and slice (E) views, as well as slice view of the S60 shell (F), respectively. The blank protrusions representing the displayed αTSR antigens are indicated in (E). (G and H) Fitting of the crystal structures of 60 αTSR antigens (blue cartoon representation) into the electron density maps of the protrusion regions, showing in full (G) and slice (H) views respectively. (I) A zoom-in view of the fitting region of (H) showing the N- and C-terminal ends of two αTSR antigens. (J and K) Structural model of the S60-αTSR nanoparticle (J), with its surface displayed αTSR antigens (K). (L) Crystal structure of the inner shell of the 60-valent feline calicivirus (FCV) VLP (PDB code: 4PB6, Orange surface representation) showing the surface exposed C-terminal ends of the S domain. All images are shown at five-fold axes.

