
Figure 1. Cxcl1 is overexpressed in Ras-p53 cooperative PDAC and governs spatial exclusion of T-cells in human tumors.
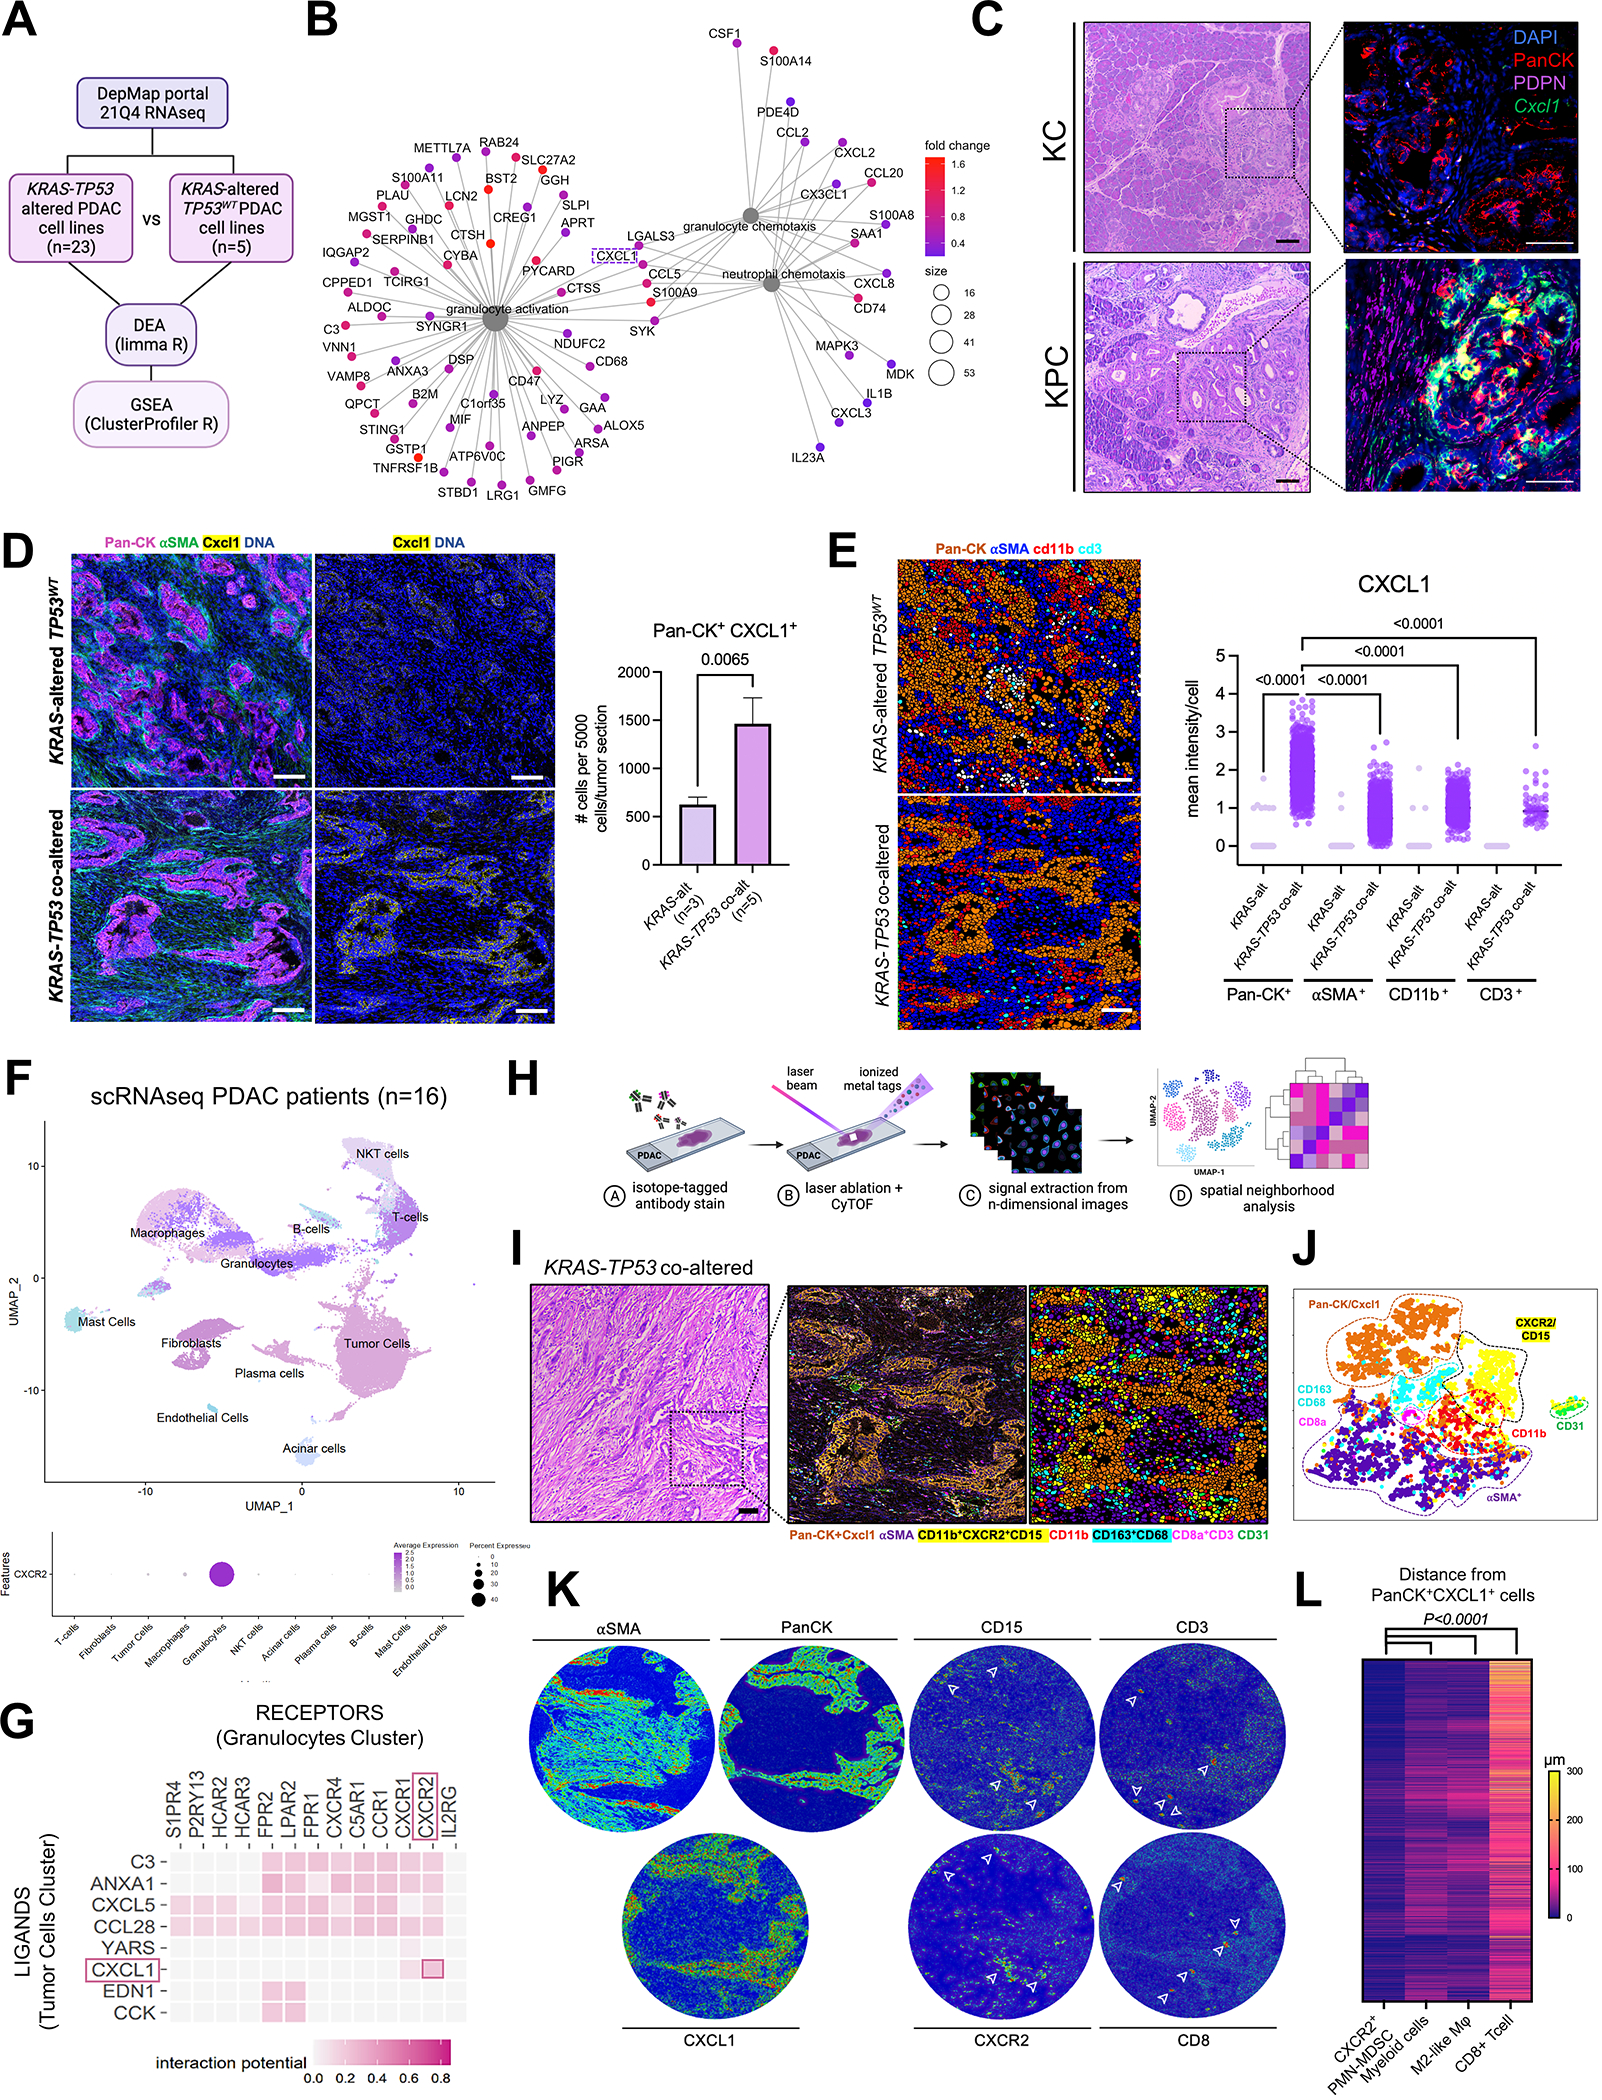
A, Schematic of transcriptomic comparison between KRAS-TP53 co-altered (n=23) and KRAS-altered/TP53WT(n=5) human PDAC cell lines from the Cancer Cell Line Encyclopedia (CCLE), with subsequent differential expression analysis (DEA) and gene set enrichment analysis (GSEA); B, Net plot visualizing the top 3 gene-sets related to granulocyte/neutrophil function overexpressed in KRAS-TP53 co-altered PDAC tumor-cell transcriptomes, with 5 transcripts conserved between these pathways (CXCL1 highlighted in dashed box) shown; C, H&E sections paired with immunostaining for pancytokeratin (PanCK), podoplanin (PDPN), and RNA-in situ hybridization to detect Cxcl1 mRNA in representative sections from volume-matched tumors in genetic models LSL-K-rasG12D/+; Trp53R172H/+; Pdx-1Cre/+ (KPC; 6-months old) and LSL-K-rasG12D/+;Pdx-1Cre/+ (KC; 12-months old). Quantification of relative Cxcl1 mRNA expression in PanCK+ cells provided in Supplementary Fig. S1C; D, Imaging Mass Cytometry (IMC) comparing epithelial expression of CXCL1 in human KRAS-TP53 co-altered (n=5) compared to KRAS-altered/TP53WT (n=3) tumors at single-cell resolution, with adjacent histogram showing quantification of average number of PanCK+CXCL1+ cells per 5000 single cells in each tumor section across groups; E, IMC image segmentation into PanCK+ tumor cells, αSMA+ fibroblasts, CD11b+ myeloid cells, CD3+ T cells in KRAS-TP53 co-altered (KRAS+TP53) vs. KRAS-altered/TP53WT (KRAS) human PDAC sections, with adjacent quantification of mean intensity of CXCL1 expression in each cell type across groups. Cell populations were grouped according to any positive pixel intensity for the respective marker, with discrepancies and overlap between phenotypes reconciled manually; F, Uniform Manifold Approximation and Projection (UMAP) showing annotated clusters from single-cell RNA sequencing (scRNAseq) data in human PDAC patient samples (n=16; top), with bubble plot showing relative CXCR2 expression between different clusters (bottom); G, Heatmap showing tumor cell (donor) to granulocyte (recipient) ligand-receptor interactome in human scRNAseq dataset using NicheNet algorithm, with CXCL1-CXCR2 interaction highlighted (red box); H, Schematic representation of IMC workflow to provide spatially resolved single-cell phenotypes of human PDAC tumors; I-J, H&E, spatial phenotype map, and image segmentation of representative KRAS-TP53 co-altered human PDAC tumor section (I), with single-cell clustering in T-distributed Stochastic Neighborhood Embedding (tSNE) maps (J) of 72,880 single-cells in 8 pre-defined ROIs each from a unique patient sample, distributed into epithelial/tumor cell (PanCK+CXCL1+), stromal/fibroblast (αSMA+), endothelial (CD31+), myeloid (CD11b+), PMN-MDSC (CD15+CXCR2+), M2-like macrophage (CD68+CD163+), and CD8+ T cell (CD3+CD8+) populations; K, Tissue heatmaps showing expression of αSMA, PanCK, CXCL1, CD15, CXCR2, CD3 and CD8 in representative KRAS-TP53 co-altered human PDAC tumor section; L, Heatmap depicting spatially resolved distances of single CXCR2+CD11b+CD15+ PMN-MDSC, CD11b+ myeloid cell, CD68+CD163+ M2-like macrophage, and CD3+CD8+ T-cells from PanCK+ tumor-cells in 8 ROIs from human PDAC sections.