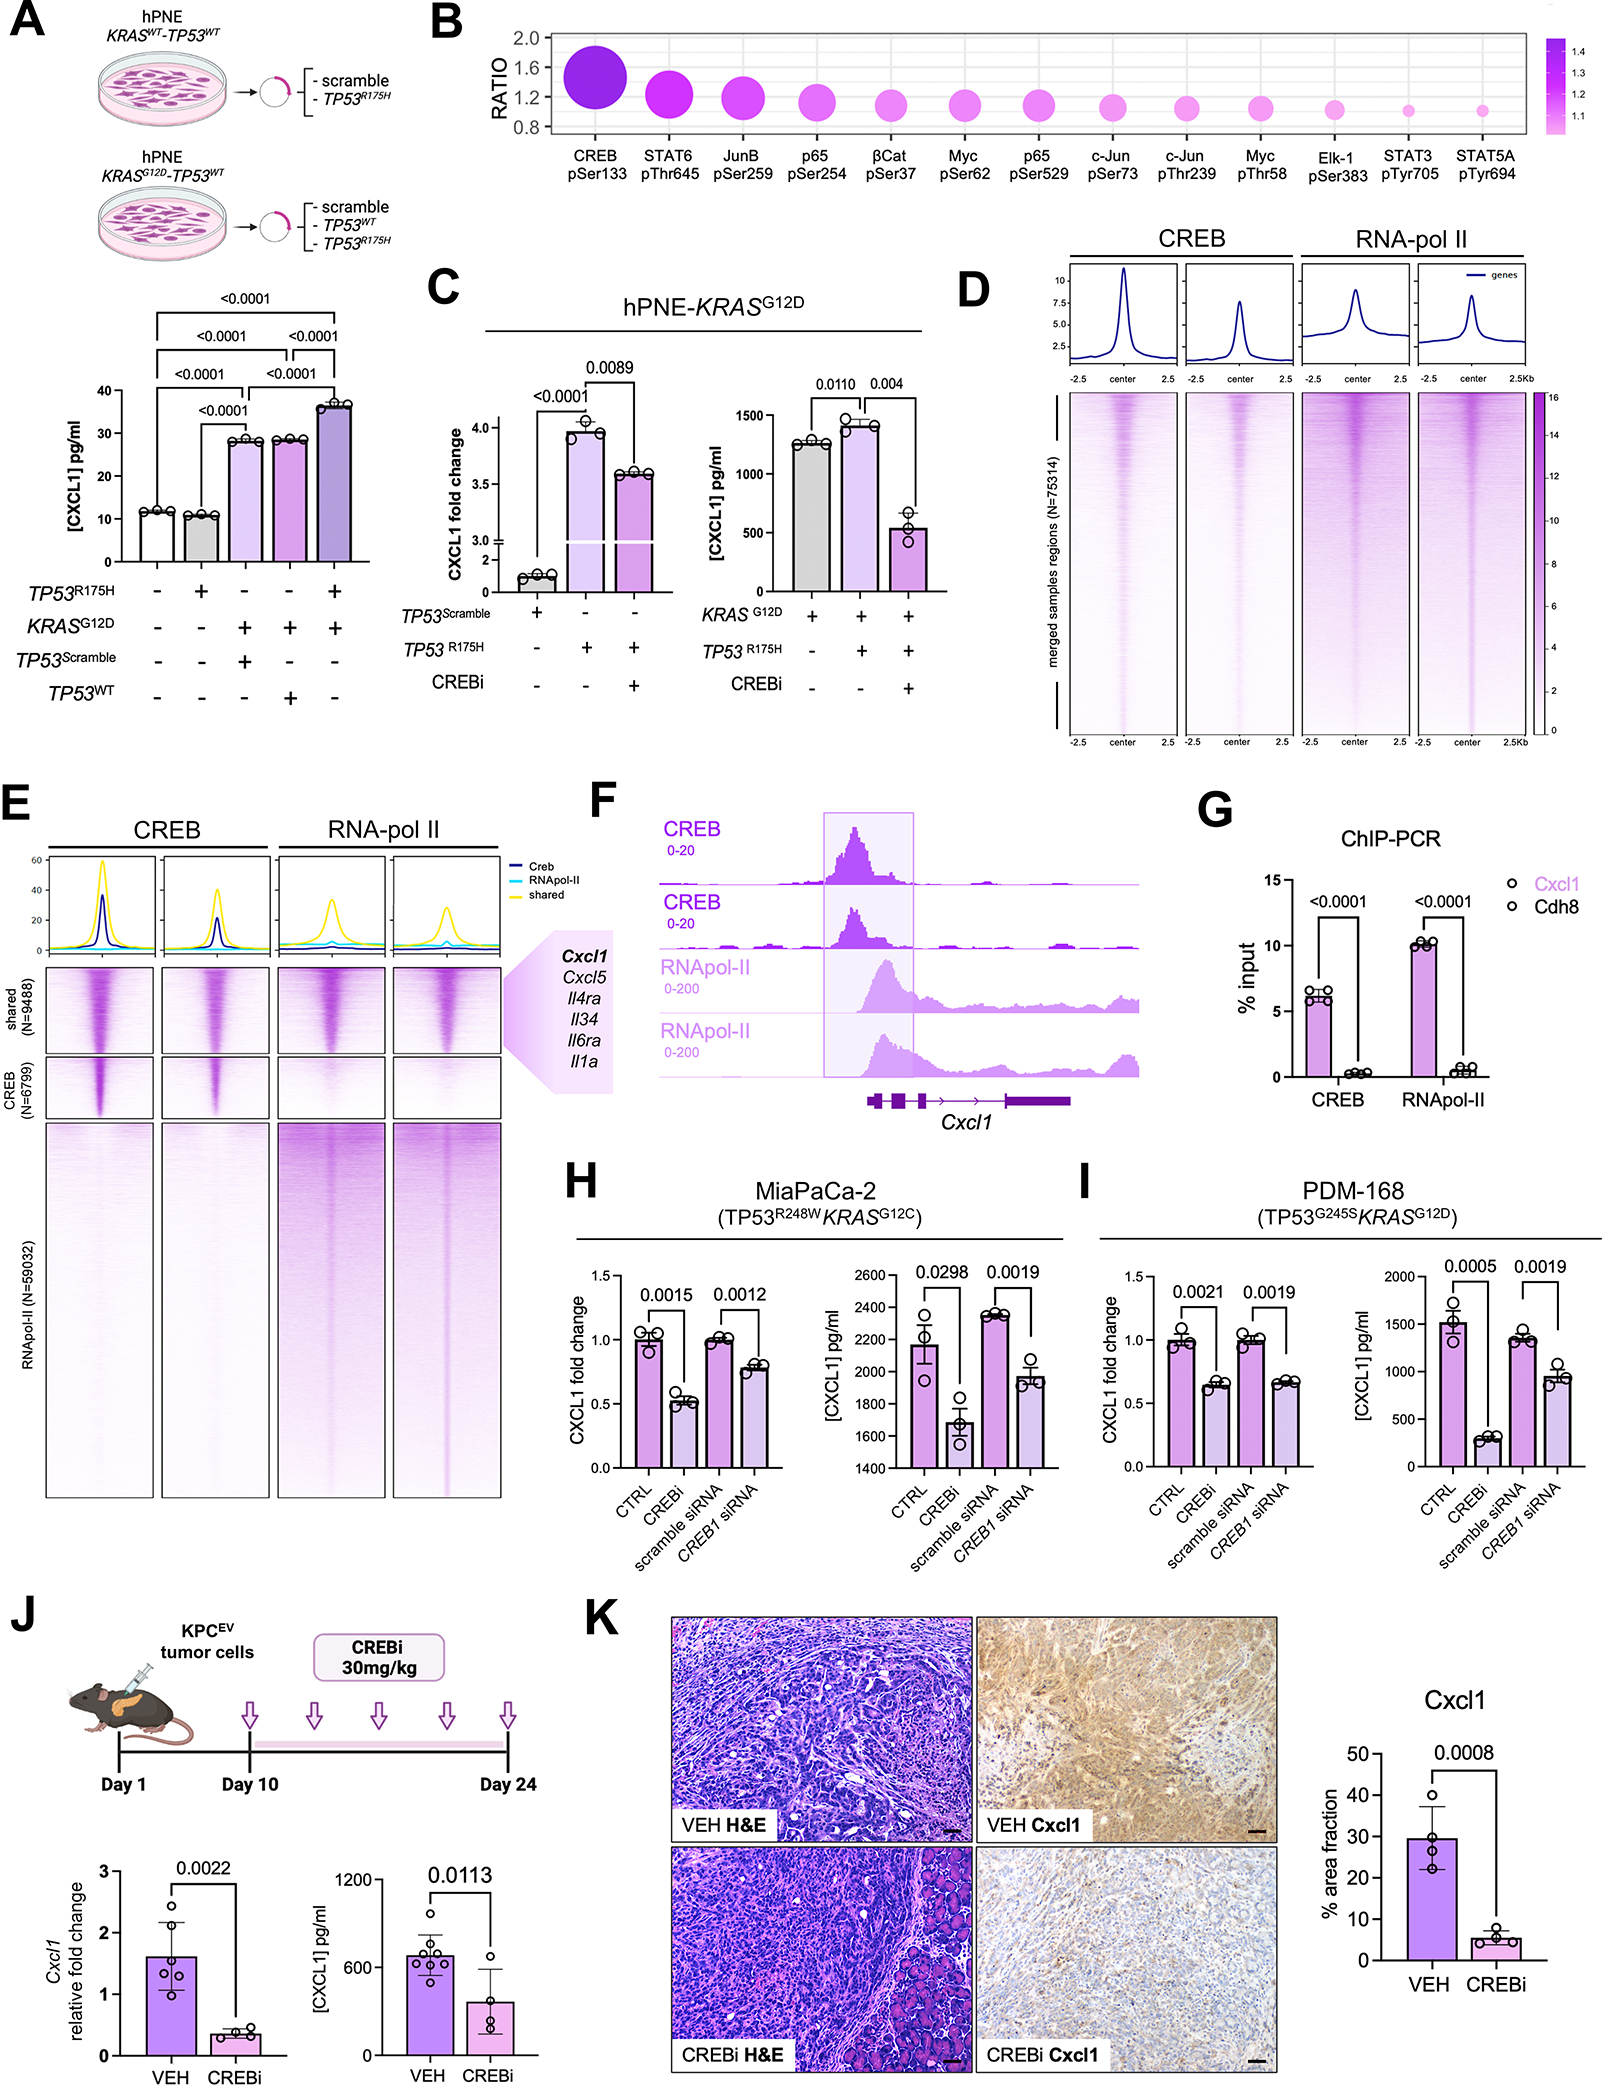
Figure 2. KRAS and TP53 mutations cooperate to transcriptionally regulate CXCL1 via CREB activation in pancreatic cancer cells.

A, Schematic representing experimental constructs utilized to overexpress TP53WT or TP53R175H in isogenic hPNE-KRASWT or hPNE-KRASG12D pancreatic epithelial cells (top). Histogram showing Cxcl1 secretion from each hPNE cell system annotated by respective KRAS and/or TP53 mutational status (bottom); B, Bubble plot representing the top 10 transcription factors hyperphosphorylated in hPNE-KRASG12DTP53R175H compared with hPNE-KRASG12DTP53WT cells, with relative ratio of expression indicated on y-axis; C, Histograms representing relative fold change in CXCL1 gene expression (left) and secretion (in pg/mL; right) from hPNE-KRASG12DTP53WT and hPNE-KRASG12DTP53R175H in absence or presence of Creb inhibitor 666-15 (CREBi 0.5 μM for 24h, n=3); D, Chromatin immunoprecipitation and sequencing (ChIP-seq) peak signals and heat maps of CREB regions in CREB and RNApol-II ChIP material (n=2 biologic replicates each) in Kras-Trp53 cooperative KPC 6694c2 cells; E, ChIP-seq heatmaps showing co-occupied CREB and RNApol-II peaks (N=9488), CREB-unique peaks (N=6799), RNApol-II unique peaks (N=59032), with adjacent callout box showing curated gene module implicated in inflammatory signaling and innate immune regulation; F, Integrative Genome Viewer (IGV) plot visualizing co-occupancy of peaks in CREB and RNApol-II ChIP-seq data at the transcriptional start site of Cxcl1 promoter; G, ChIP-qPCR of Cxcl1 and Cdh8 (negative control) from CREB and RNApol-II immunoprecipitated purified DNA in KPC 6694c2 cells; H-I, CXCL1 gene expression (left) and secretion (right) each in human MiaPaCa-2 cells (H) and human PDM-168 patient-derived organoids (I) in absence or presence of CREBi 666-15 (0.5 μM for 24h) or absence or presence of Creb siRNA (n=3 each); J, Schematic of Creb inhibitor treatment of KPC orthotopic mice in vivo (top). Bar plots showing Cxcl1 gene expression via qPCR and protein levels via ELISA (in pg/mL) in whole tumor lysates from vehicle-treated vs. Crebi-treated mice (n=4–7 mice); K, Cxcl1 immunostaining with corresponding H&E staining in representative tumor sections from vehicle- vs. CREBi-treated mice (n=4–5/group; scale bar=50μm).
