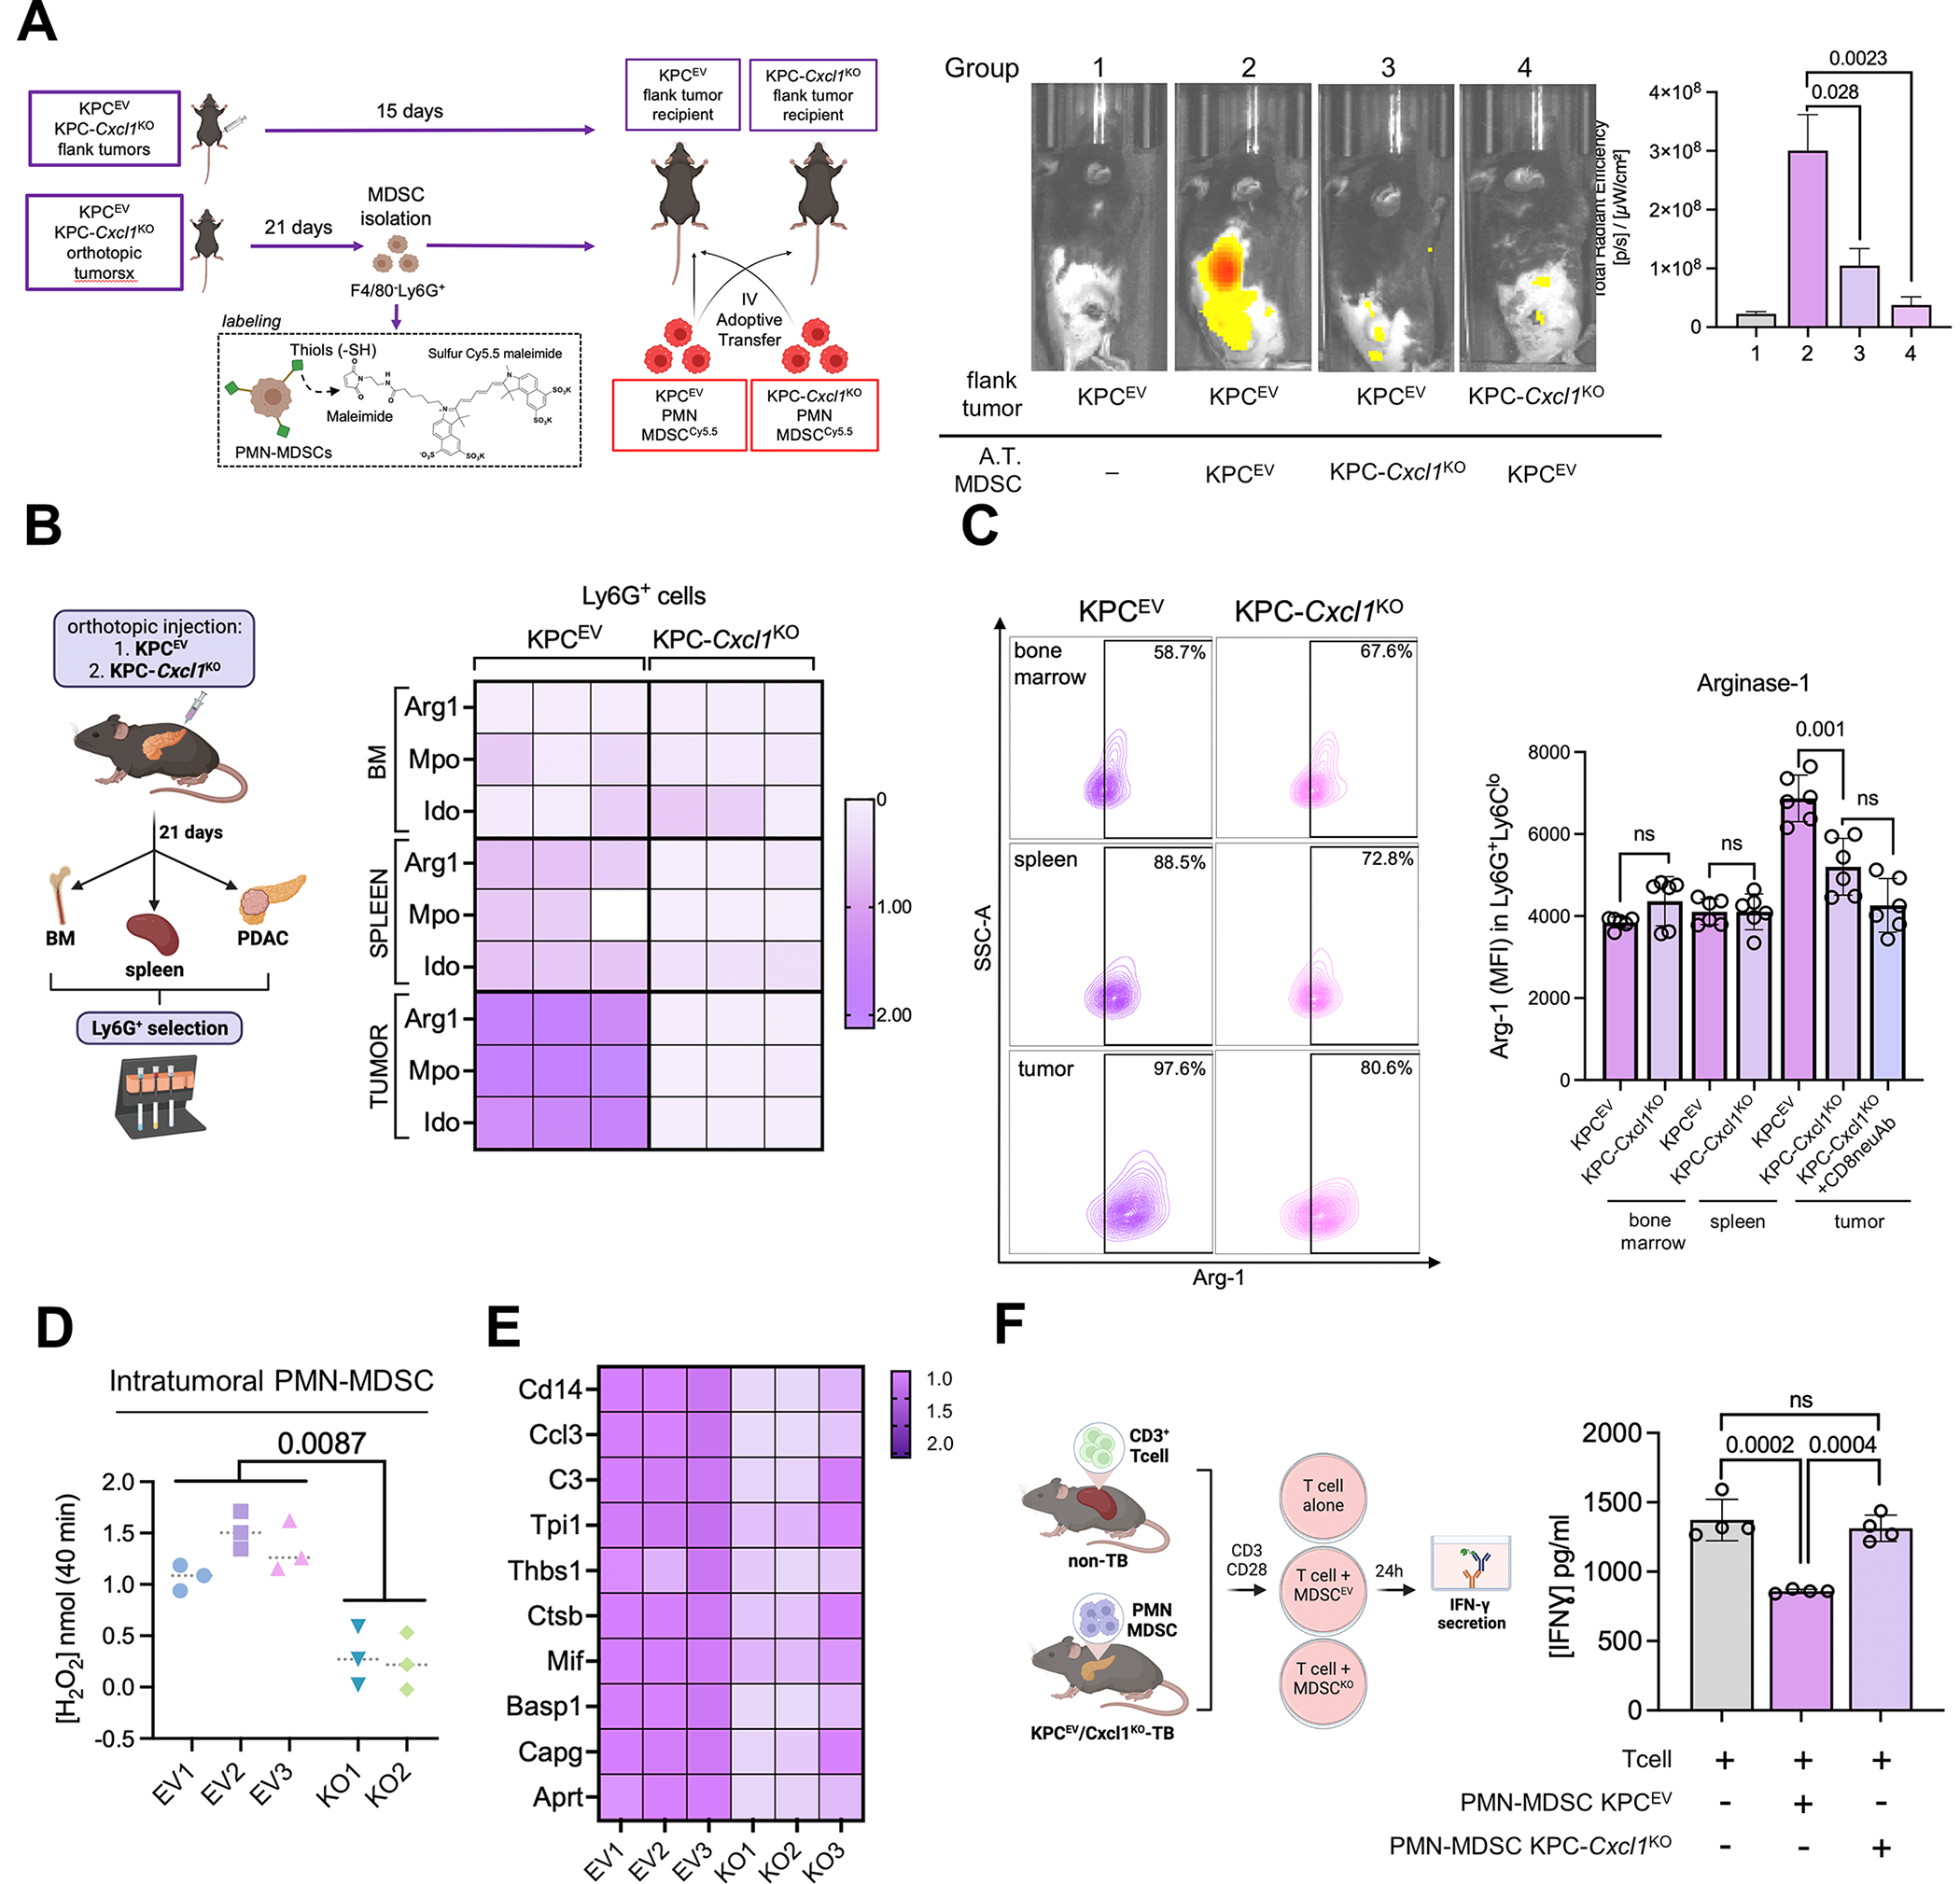
Figure 4. Silencing of cancer cell-intrinsic Cxcl1 reprograms trafficking dynamics and immunosuppressive potential of tumor-infiltrating PMN-MDSCs.

A, Experimental design of adoptive transfer experiments in which splenic neutrophils from donor mice are labeled with sulfur Cy5.5 maleimide, adoptively transferred into recipient flank tumor-bearing mice, and PMN-MDSC trafficking visualized using IVIS (left). Representative IVIS images visualizing trafficked adoptively transferred (A.T.) splenic MDSCs from KPCEV or KPC-Cxcl1KO tumor-bearing mice to subcutaneous KPCEV or KPC-Cxcl1KO tumor-bearing mice, as indicated in the legend (center), and adjacent quantification of total radiant efficiency (TRE) of trafficked Cy5.5-labeled PMN-MDSCs in each group via IVIS (n=4/group, right); B, Schematic of experimental design (left) with adjacent heatmap depicting relative fold change of Arg1, Mpo, Ido gene expressions via qPCR in Ly6G+ cells isolated from bone marrow (BM), spleen, or tumor sites in KPCEV and KPC-Cxcl1KO orthotopic tumor-bearing mice (right). Gene expression in all other groups are relative to reference expression of genes in intratumoral Ly6G+ cells from KPCEV mice; C, Representative contour plots of arginase-1 (Arg-1) expression via flow cytometry in gated F4/80−Ly6GhiLy6Cdim cells from BM, spleen, or tumor sites in KPCEV and KPC-Cxcl1KO orthotopic tumor-bearing mice (left), with adjacent histogram showing arginase-1 mean fluorescence intensity (MFI) at respective sites in designated mice (n=6/group). Arg-1 expression in intratumoral PMN-MDSCs is also quantified from KPC-Cxcl1KO mice treated with anti-CD8 neutralizing antibody (CD8neuAb); D, Arginase-1 enzymatic activity via colorimetric assay in intratumoral PMN-MDSCs from KPCEV and KPC-Cxcl1KO mice (n=2–3/group); E, Heatmap depicting relative fold change of curated gene module from activated-PMN signature (22) via qPCR from RNA extracted from intratumoral Ly6G+ cells in KPCEV vs. KPC-Cxcl1KO tumors; F, Schematic of experimental design (left), with adjacent histogram showing IFN-γ release (in pg/mL) from CD3/CD28-stimulated T-cells alone, or when co-cultured (1:3 T-cell:MDSC ratio) in combination with intratumoral PMN-MDSCs from KPCEV and/or KPC-Cxcl1KO tumor-bearing mice (n=4/group).
