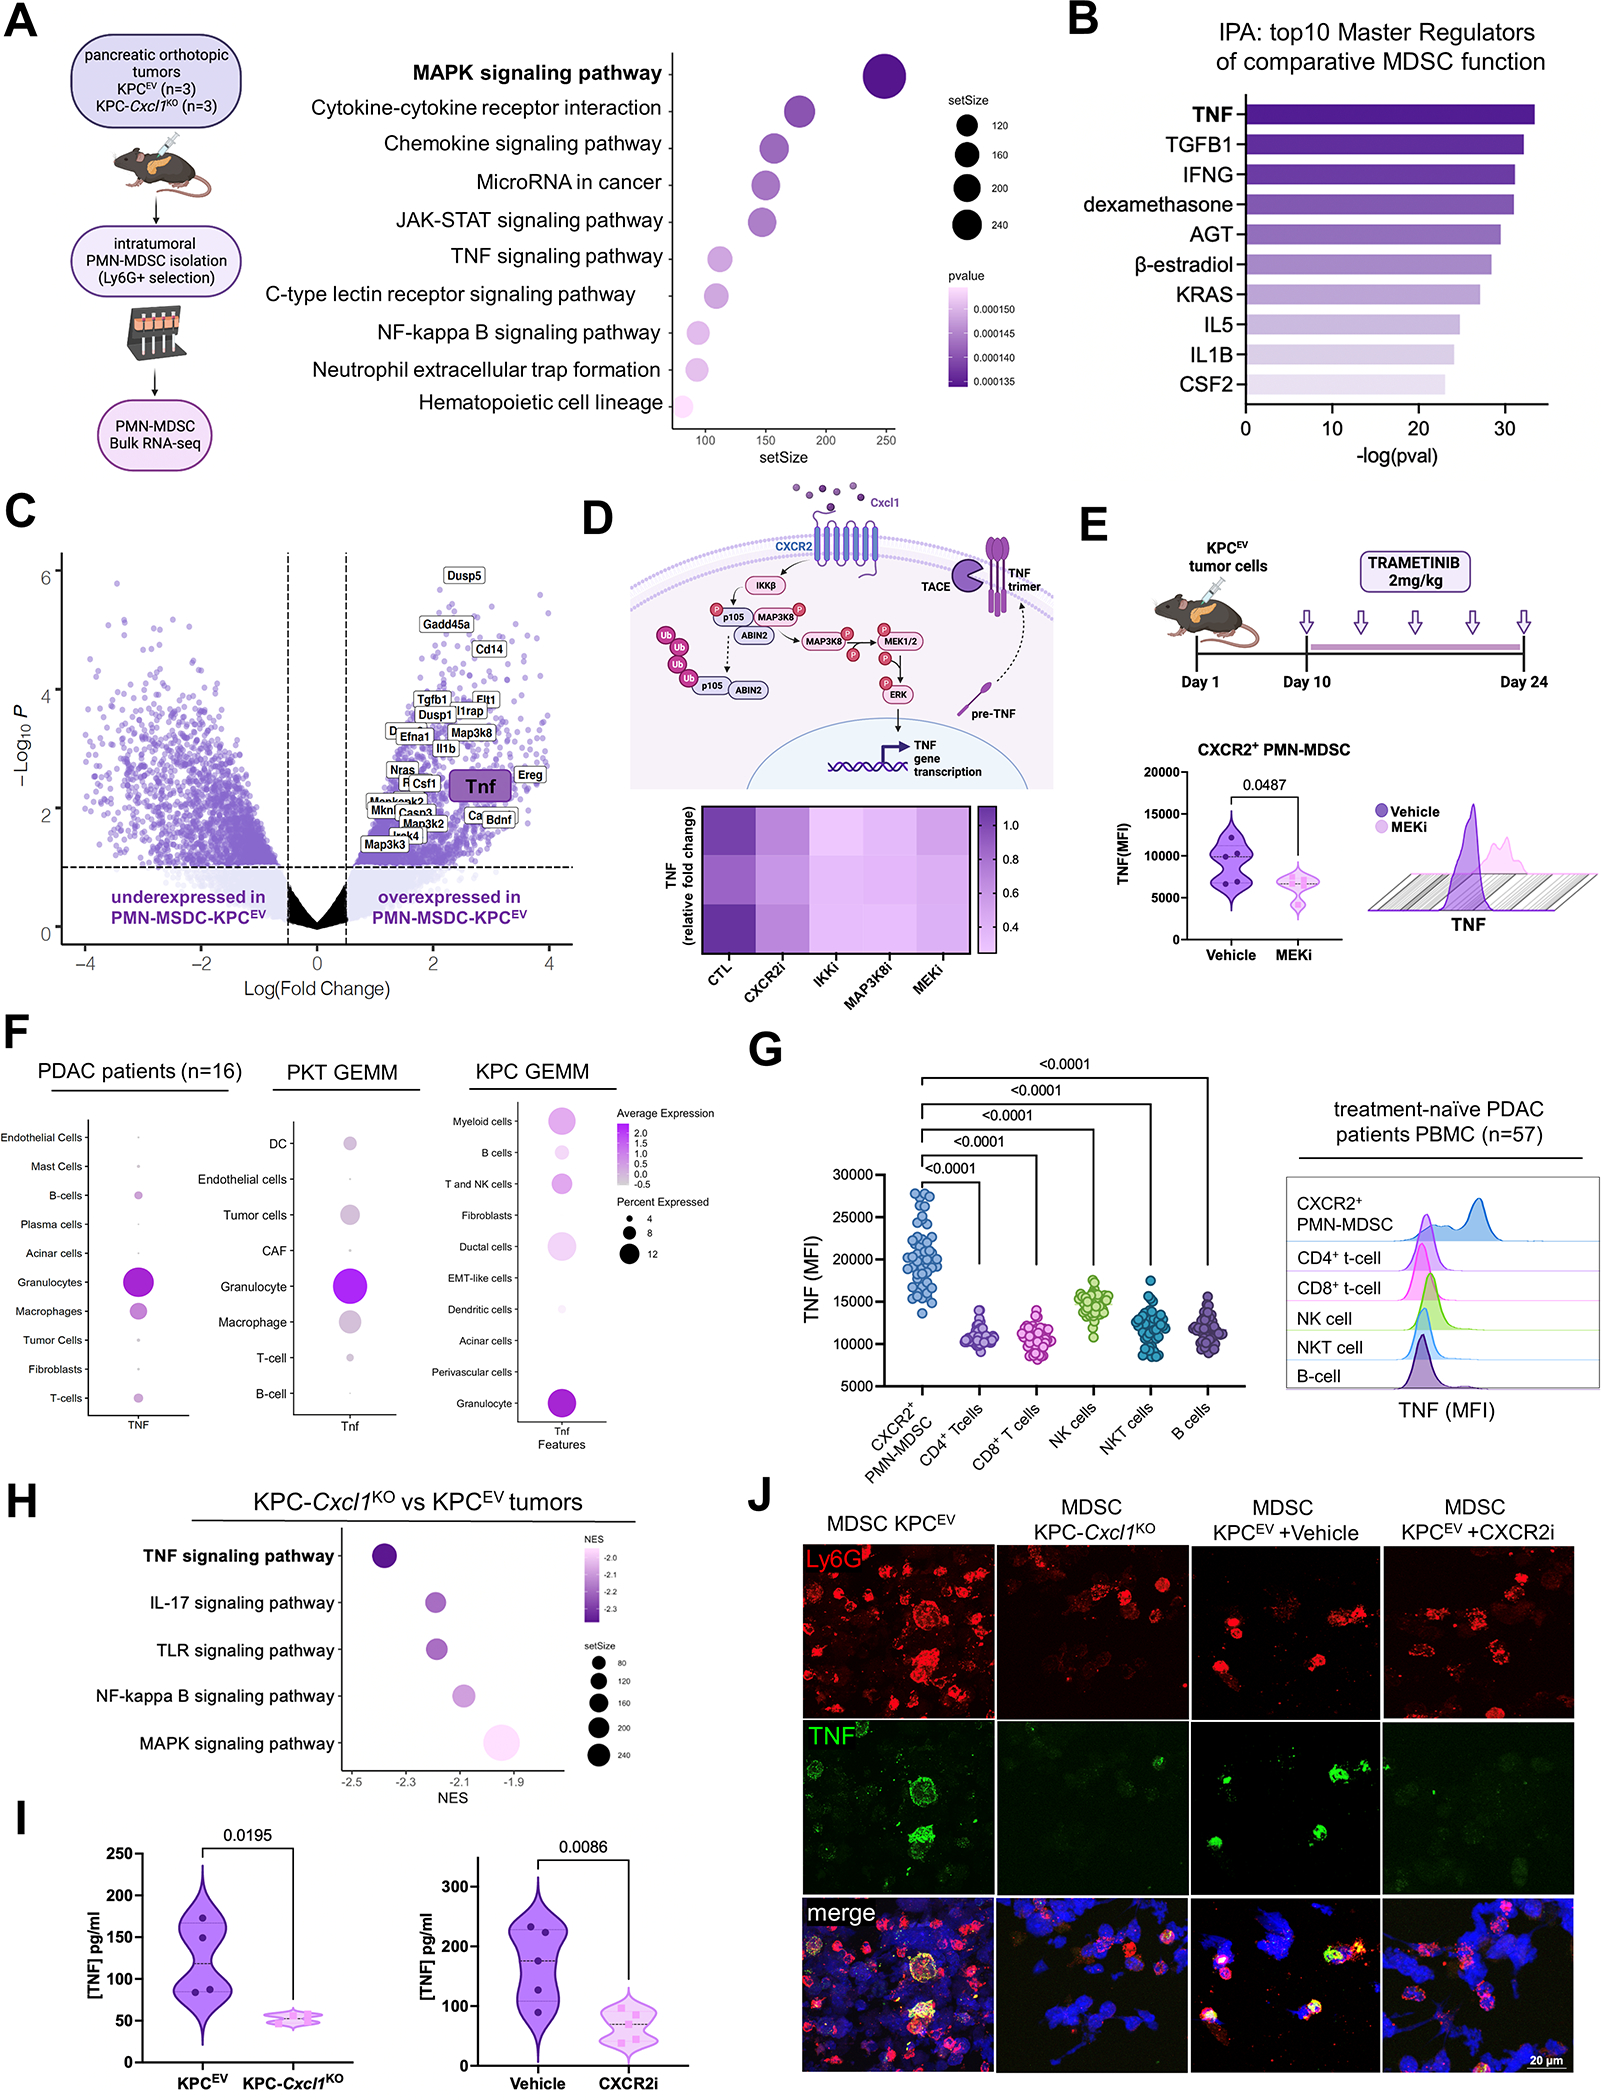
Figure 5. Neutrophil-intrinsic TNF is a central regulator of MDSC function via Cxcl1-CXCR2-MAPK signaling.

A, Schematic of intratumoral-PMN-MDSC isolation and subsequent RNA-sequencing from KPCEV and KPC-Cxcl1KO orthotopic tumors 3-weeks post-injection (left). Bubble plot depicts strongest differentially upregulated signaling pathways (using KEGG and Reactome knowledgebases) in PMN-MDSC infiltrating KPCEV relative to KPC-Cxcl1KO tumors (right), with adjusted P-value indicated in legend; B, Histogram representing top 10 predicted upstream regulators of MDSC function comparing KPCEV vs. KPC-Cxcl1KO-derived PMN-MDSCs via Ingenuity Pathway Analysis (IPA), with -log(P-value) indicated on x-axis; C, Volcano plot showing all genes from curated MAPK signaling pathways (using KEGG database) relatively enriched in MDSC-KPCEV vs. MDSC-KPC-Cxcl1KO tumors, with Tnf highlighted. Data are plotted as log(Fold Change) against -Log10P-value; D, Putative mechanism of CXCR2-MAPK-TNF signaling cascade in PMN-MDSCs (top), with heatmap visualizing relative reduction in Tnf expression upon treatment of J774M PMN-MDSCs with CXCR2 inhibitor AZD5069 (1 μM), IKK inhibitor BAY-110782 (0.1 μM), MAP3K8 inhibitor #871307–18-5 (250 nM), and MEK inhibitor trametinib (250 nM) (bottom), with relative fold change indicated in legend; E, In vivo dosing scheme of trametinib treatment in orthotopic KPC mice (top), with violin plot and representative histogram plot from flow cytometry experiments showing TNF mean fluorescence intensity (MFI) in intratumoral CXCR2+ PMN-MDSCs compared between vehicle and MEKi-treated groups (n=5/group); F, Dot plot showing relative TNF gene expression across cell clusters in single-cell RNA sequencing data from human PDAC patients (n=16)(15), PKT genetically engineered mouse model (GEMM) (16), and KPC GEMM (29); G, Plot and adjacent histogram plots showing TNF mean fluorescence intensity (MFI) via flow cytometry in peripheral blood mononuclear cells (PBMC) retrieved from treatment-naïve PDAC patients at UMiami (n=57); H, Bubble plot highlighting top 5 downregulated oncogenic signaling pathways (KEGG) in KPC-Cxcl1KO compared with KPCEV whole-tumor transcriptomes, with TNF signaling bolded; I, Violin plots showing TNF levels (in pg/mL) using ELISA in whole tumor lysates from KPCEV vs. KPC-Cxcl1KO (left), and vehicle-treated or CXCR2i AZD5069-treated orthotopic KPC mice (right) (n=5/group); J, Immunofluorescence using confocal microscopy showing Ly6G (red) and TNF (green) expression in polylysine coated cover slip-mounted intratumoral Ly6G+ cells from KPCEV, KPC-Cxcl1KO, KPCEV vehicle-treated, and KPCEV CXCR2i-treated tumor-bearing orthotopic mice.
