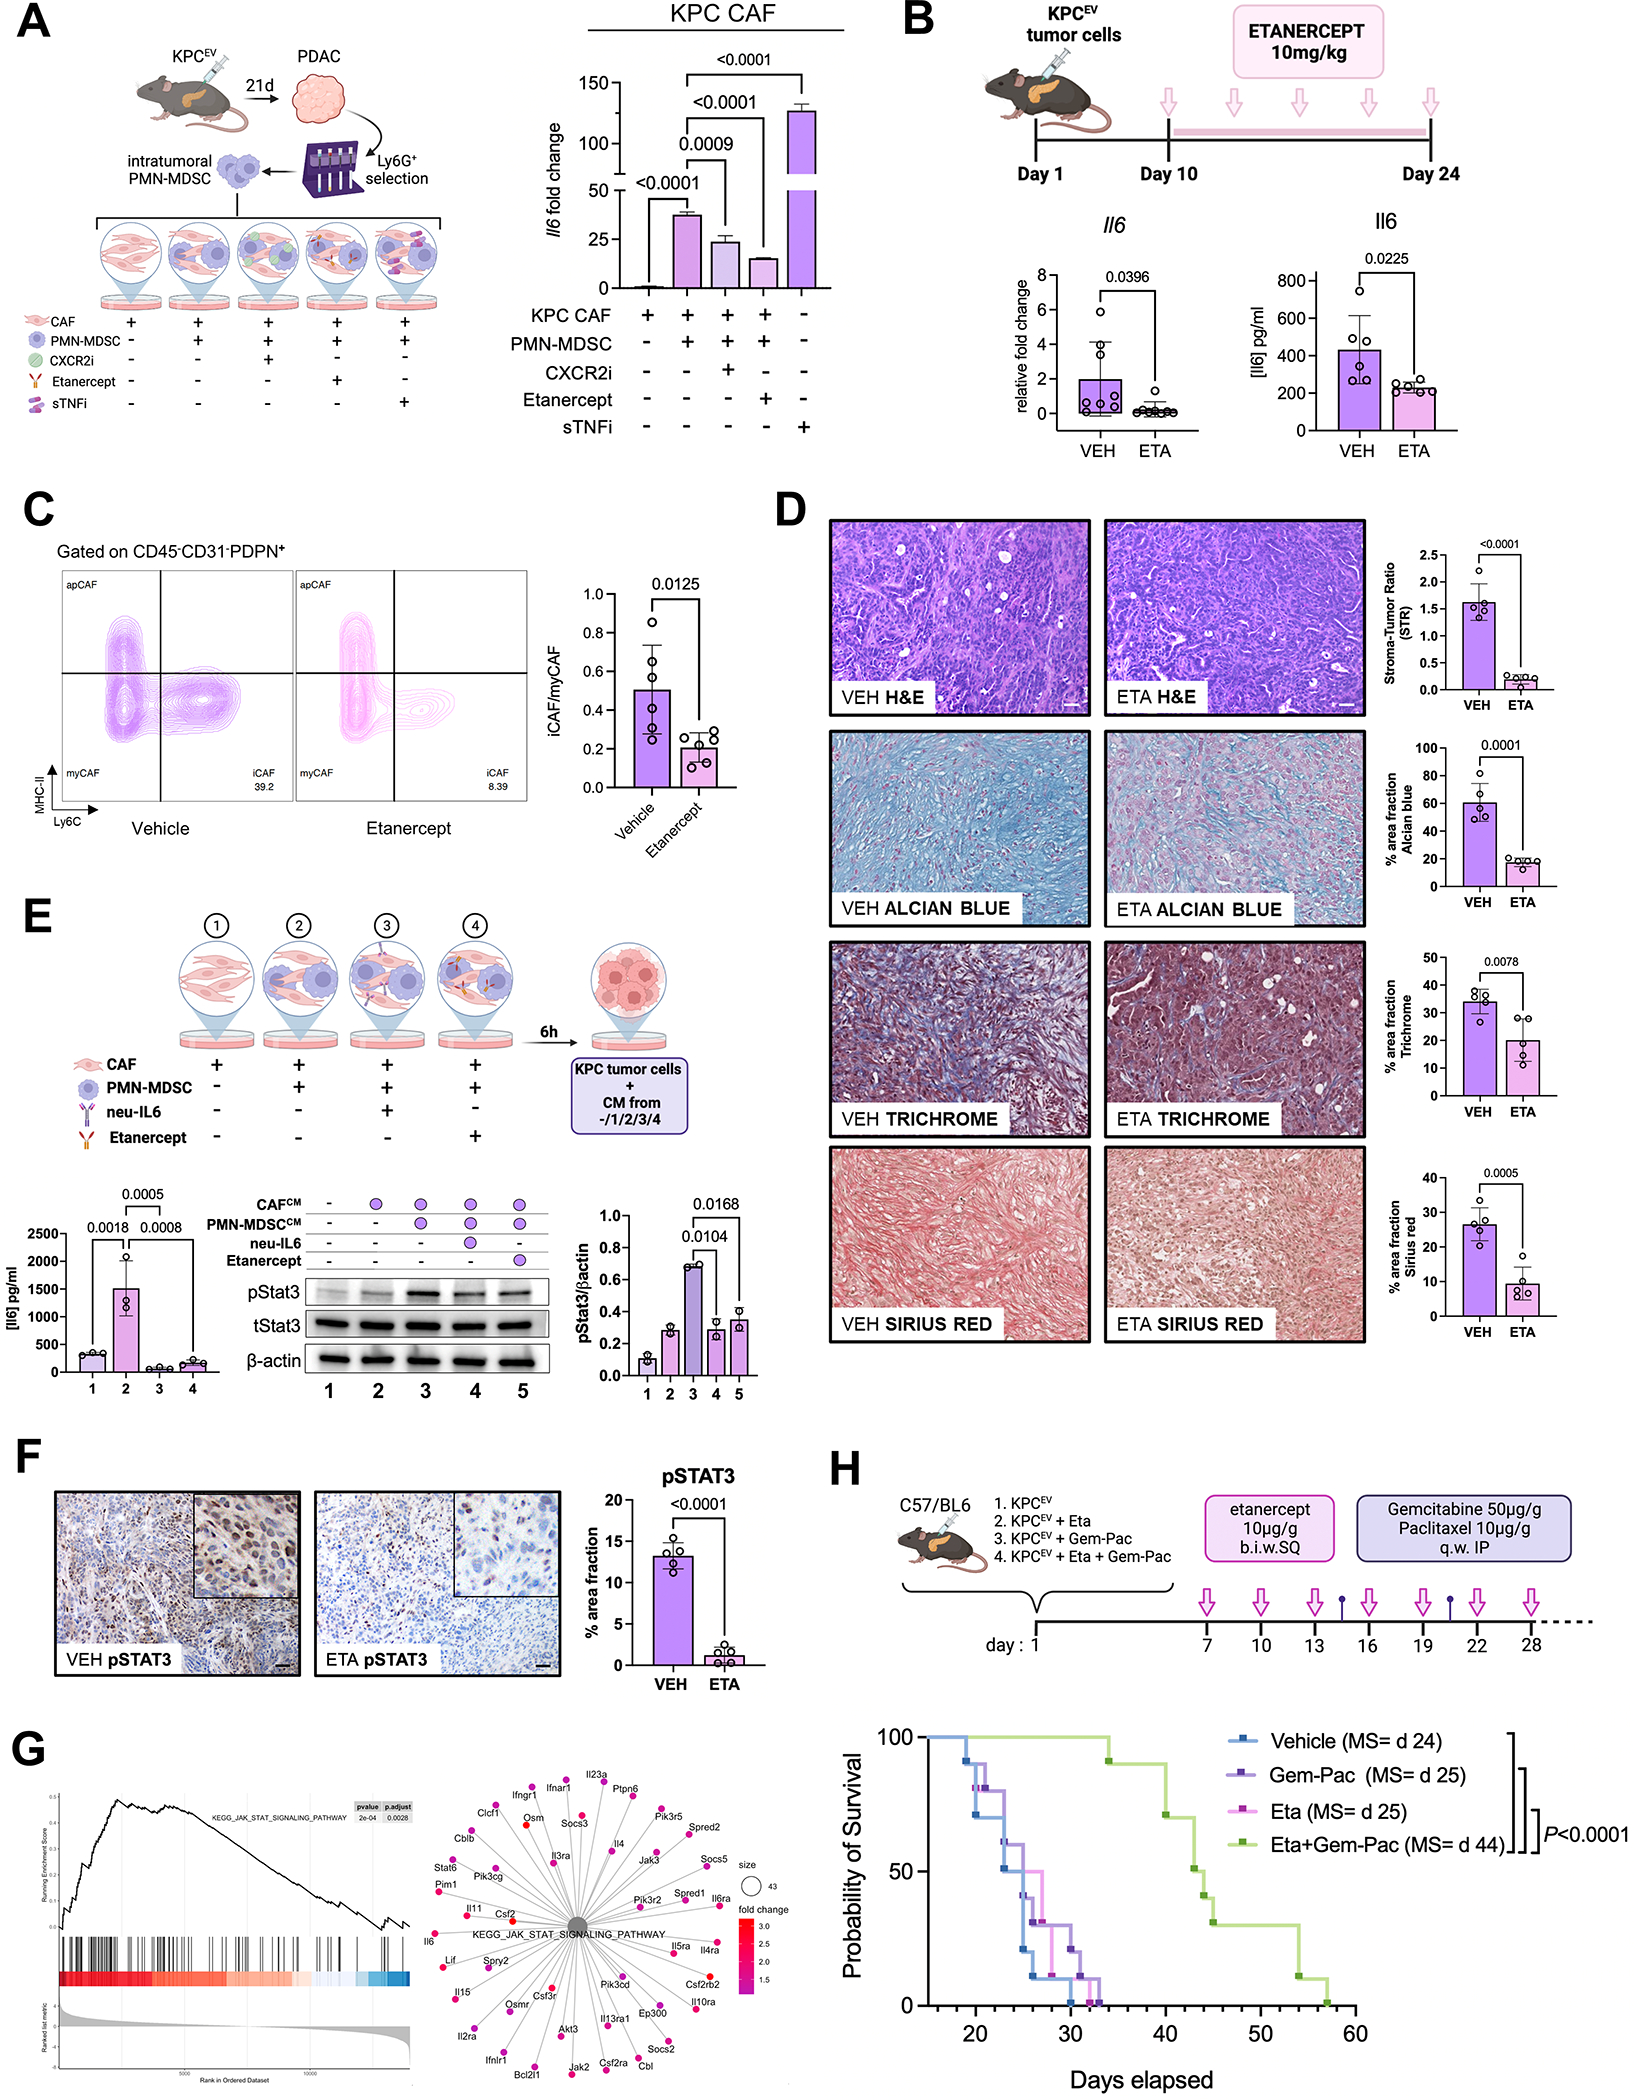
Figure 7. Systemic inhibition of TNFR2 mitigates stromal inflammation and sensitizes PDAC to chemotherapy.

A, Experimental design of ex vivo co-cultures of intratumoral PMN-MDSCs with KPC cancer-associated fibroblasts (CAF) (left), with histograms depicting relative fold change of Il6 gene expression via qPCR in KPC CAFs alone, or CAFs co-cultured with PMN-MDSC with or without preconditioning with CXCR2i AZD5069 (1 μM), TNFR2i etanercept (20 μg/ml), or soluble TNF inhibitor infliximab (sTNFi; 20 μg/ml) (n=4/group); B, In vivo dosing scheme of etanercept in orthotopic KPC mice (top), with bar plot showing Il6 transcription (left) or protein levels by ELISA in whole tumor lysates from vehicle (VEH) or etanercept (ETA)-treated mice (n=6–8 mice/group); C, Representative contour plots showing inflammatory CAF (iCAF; Ly6C+MHC-II−), myofibroblastic CAF (myCAF; Ly6C−MHC-II−) and antigen-presenting CAF (apCAF; Ly6C−MHC-II+) populations gated on CD45−CD31−PDPN+ cells via flow cytometry in vehicle and etanercept-treated mice, and adjacent bar plot visualizing iCAF/myCAF ratio quantification across biologic replicates (n=6 mice/group); D, Representative H&E showing stromal-tumor ratio via H&E, Alcian Blue, Trichrome, and Sirius Red staining in tumor sections from vehicle or ETA-treated mice (scale bar=50μm), with adjacent bar plot visualizing respective quantifications across biologic replicates (n=5 mice/group, 1 ROI/mouse); E, Experimental design showing MDSC:CAF co-culture groups—labeled 1 through 4—from which conditioned media was generated and incubated with KPC6694c2 tumor cells (top). Bar plot showing IL-6 secretion via ELISA in KPC CAFs from experimental conditions 1–4 (bottom left, n=3). Western blot for pStat3 (tyr-705), total Stat3, and β-actin protein levels in KPC6694c2 tumor cell lysates upon conditioning with media from co-culture groups 1–4 (bottom center), with adjacent bar plot showing respective quantification of pStat3/β-actin ratio (bottom right); F, pSTAT3 immunostaining in tumor sections from vehicle or ETA-treated mice (both 20x; scale bar=50μm), with inset showing magnified region depicting epithelial-specific staining pattern. Adjacent bar plot shows quantification of %area staining for pSTAT3 across biologic replicates (n=5 mice/group); G, Enrichment plot (left) and net plot (right) showing disproportionate downregulation of KEGG_JAK_STAT_SIGNALING_PATHWAY in KPC-Cxcl1KO compared with KPCEV tumor transcriptomes; H, In vivo treatment schedules (top), and Kaplan-Meier survival curves for each of the treatment groups (n=10 mice/group): vehicle, etanercept (Eta) alone, gemcitabine+paclitaxel (Gem-Pac) alone, and Eta+Gem-Pac. Median survival (MS) of each group is indicated in parentheses.
