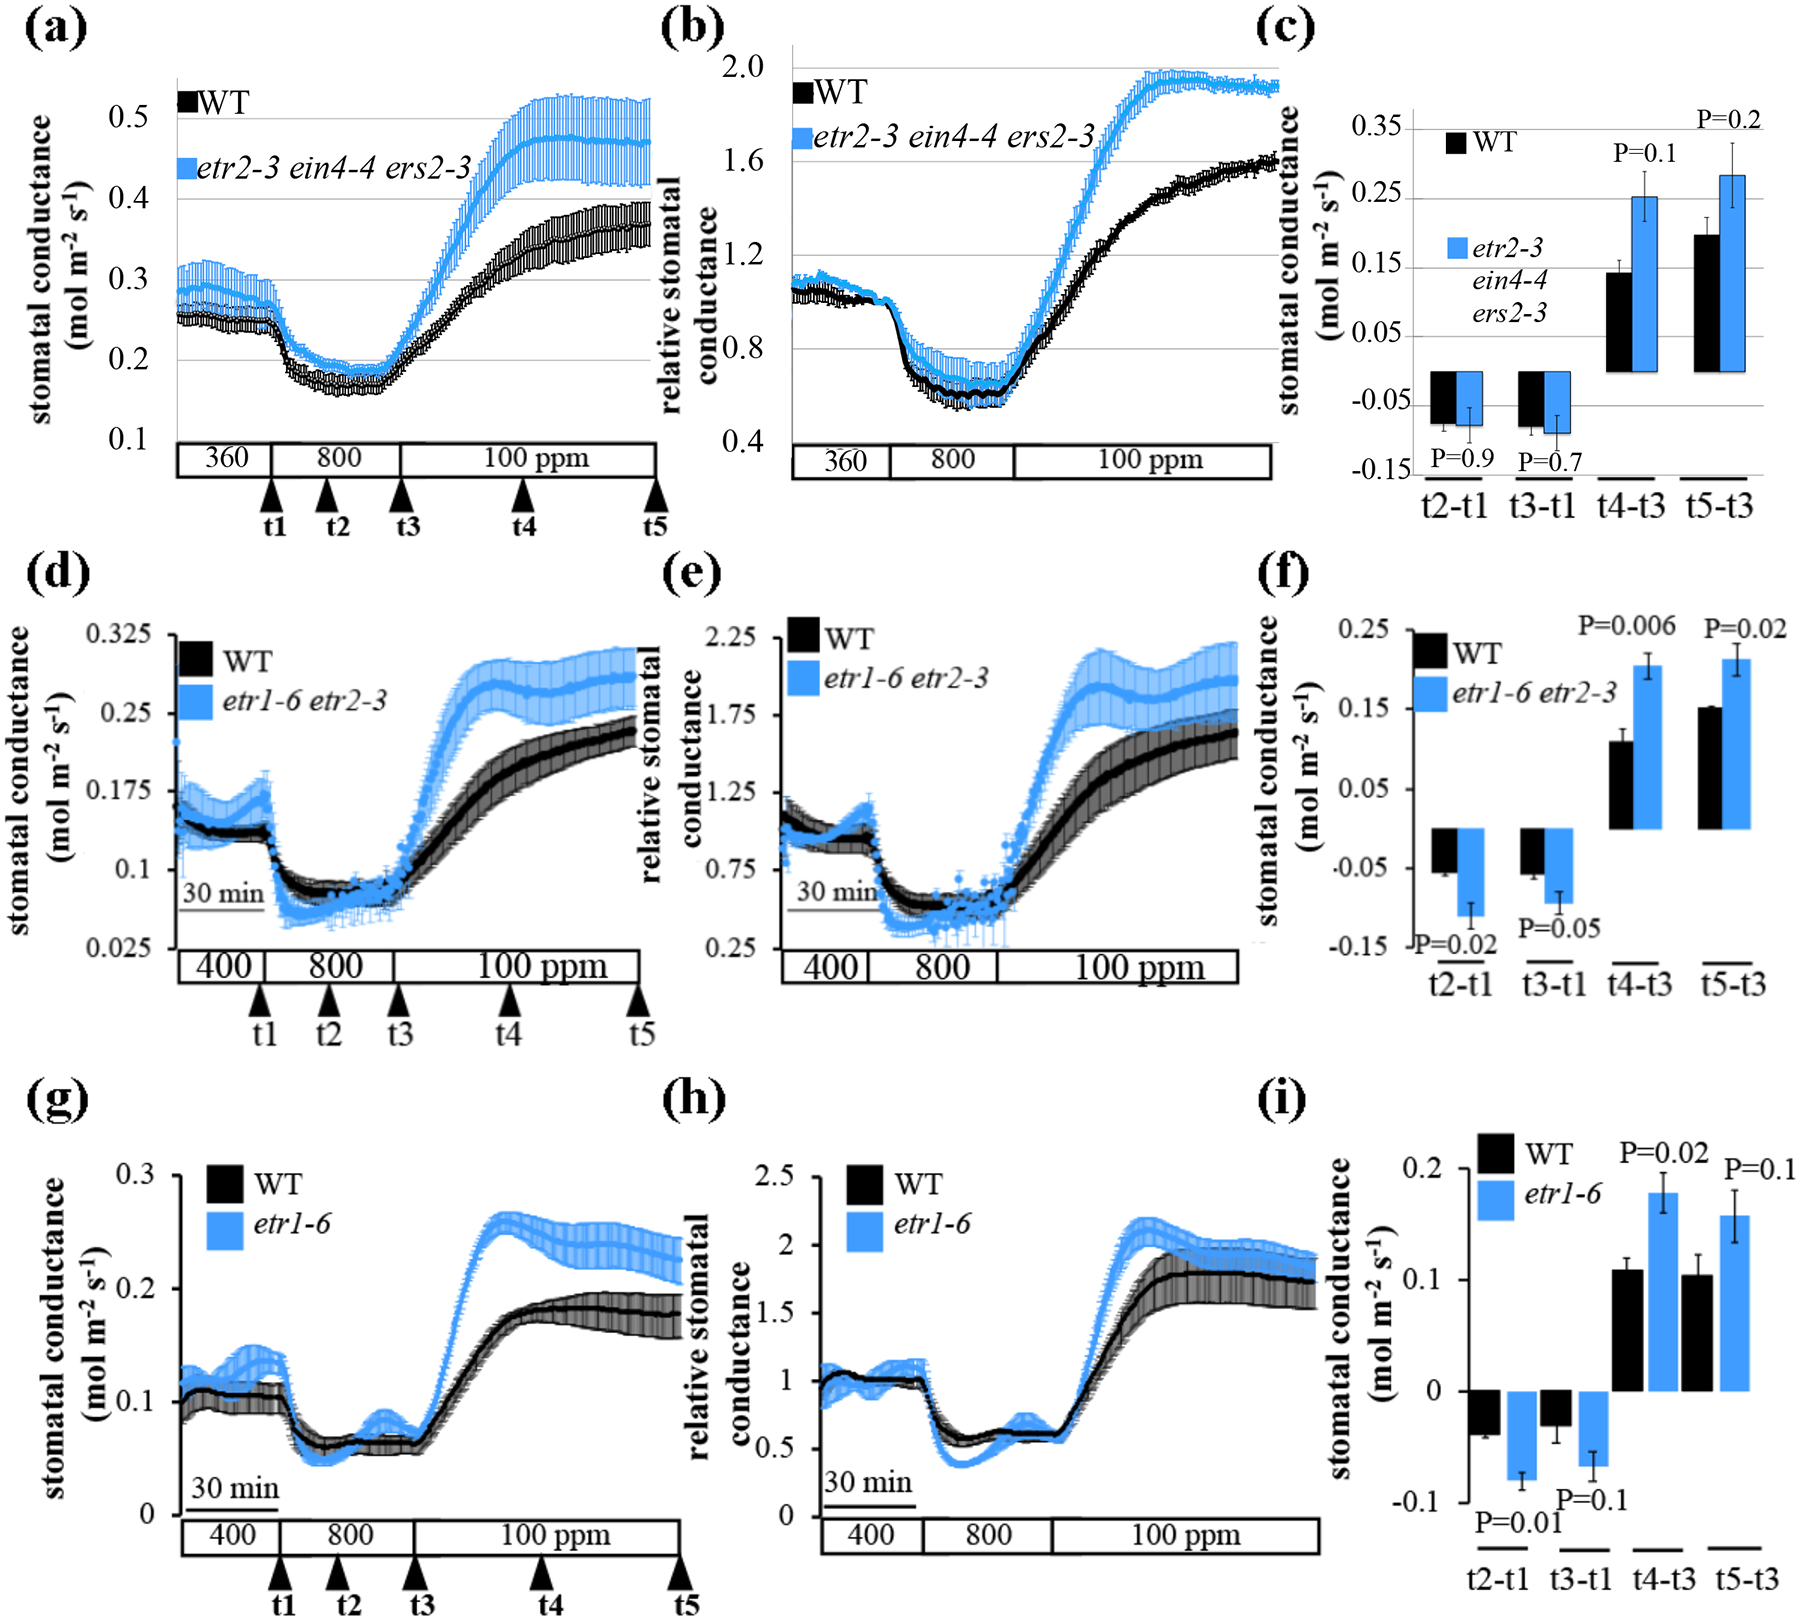
Fig. 7: Leaves of the ethylene receptor hypersensitive mutants, etr2-3;ein4-4;ers2-3 triple mutant, etr1-6;etr2-3 double mutant and the etr1-6 single mutant plants, show accelerated CO2-induced stomatal conductance responses.

The graphs show average leaf stomatal conductance from intact plants of wild-type (WT, Col-0), (a-c) etr2-3;ein4-4;ers2-3 triple mutant, (d-f) etr1-6;etr2-3 double mutant, (g-i) etr1-6 single mutant of A. thaliana in response to [CO2]-shifts as indicated at the bottom (ppm). (a, d and g) Stomatal conductance means (±SEM) of (a-c) n=4 (WT), and n=3 (etr2-3;ein4-4;ers2-3), (d-f) n=3, (g-i) n=3 leaves from individual plants per genotype. (b, e and h) Stomatal conductance (in panels a, d and g) were normalized to the stomatal conductance at 400 ppm [CO2] before shifting to 800 ppm [CO2]). (c, f, and i) Changes in absolute stomatal conductance (mean ± SEM) were calculated at the indicated time points based on the data presented on panels a, d and g (t1 = stomatal conductance at 400 ppm [CO2], t2=15 min following exposure to 800 ppm [CO2], t3=30 min following exposure to 800 ppm [CO2], t4=40 min following exposure to 100 ppm [CO2], t5=80 min following exposure to 100 ppm [CO2]). Statistical analyses were done using unpaired Student’s t tests between the wild-type and the mutant line, P-value is presented above/under columns. Similar findings for the etr1-6;etr2-3 double mutant were found in additional independent experiments (see Fig. S6).
