
Fig. 4. Evolutionary constraint, PC genes, and human disease.
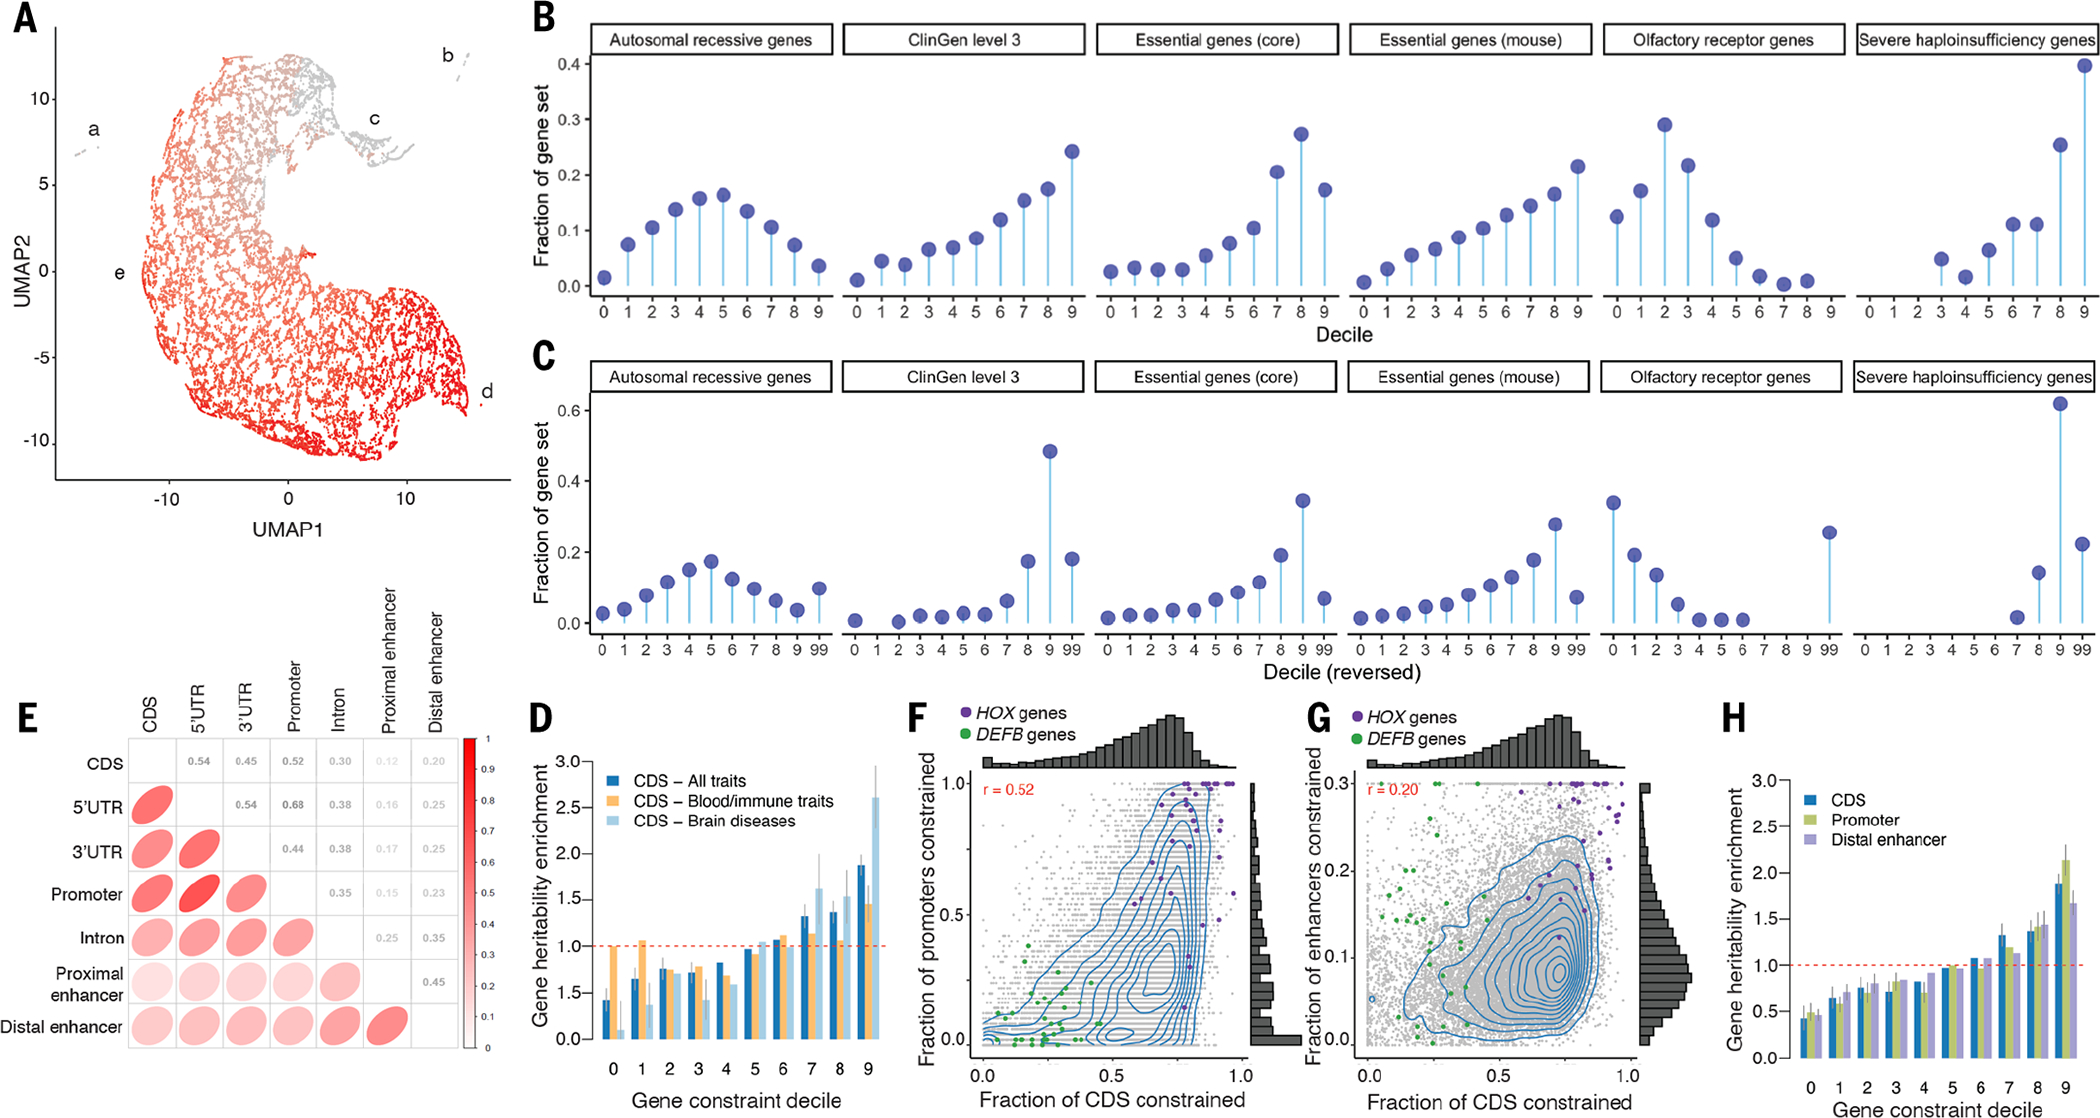
(A) Scatterplot of PC gene clustering [uniform manifold approximation and projection (UMAP) and density-based spatial clustering of applications with noise (DBSCAN)]. The x and y axes are the UMAP coordinates. Each point is a PC gene (N = 19,386). Five clusters are labeled: (a) 56 genes whose CDS bases are in complex regions that align poorly; (b) 221 genes that are apparently human- or primate-specific; (c) 669 genes with good alignment and possible human-specific functions [e.g., five human leukocyte antigen (HLA) genes and 14 interferon-α genes]; (d) 15 genes, all highly constrained; and (e) all other 18,425 PC genes. Coloring shows fracCdsCons, where gray indicates least and red indicates most constrained with an anticlockwise gradient in mammalian constraint from the upper middle to lower right. (B and C) Gene constraint deciles versus external gene sets as “lollipop plots” Zoonomia fracCdsCons are shown in (B). A recapitulation of figure 3 from (3) with the LOEUF decile reversed and missing data shown is presented in (C). Each panel has six subgraphs for autosomal-recessive genes, ClinGen level 3 genes, essential genes from Hart, essential genes in mouse, olfactory receptor genes, and severe haploinsufficiency genes. The x axis is the constraint decile (0 is least, 9 is most constrained, 99 is missing). The y axis is the fraction of the PC genes in a gene set in each decile as represented by circles. (D) Gene heritability enrichment for SNPs linked to genes of each decile of fracCdsCons. The dashed red line represents a null enrichment of 1. Error bars are 95% confidence intervals. (E) Spearman’s correlation of the constraint fraction between the parts of PC genes. (F and G) Fraction of CDS constraint (fracCdsCons) versus fraction of promoter constraint (F) and fraction of distal enhancer constraint (G) (shrunk to values <0.3). For (F) and (G), each point is a PC gene, and HOX genes (purple) and DEFB genes (green) are highlighted. (H) Gene heritability enrichment for SNPs linked to genes of decile of constraint in different gene features, plotted as per (D).