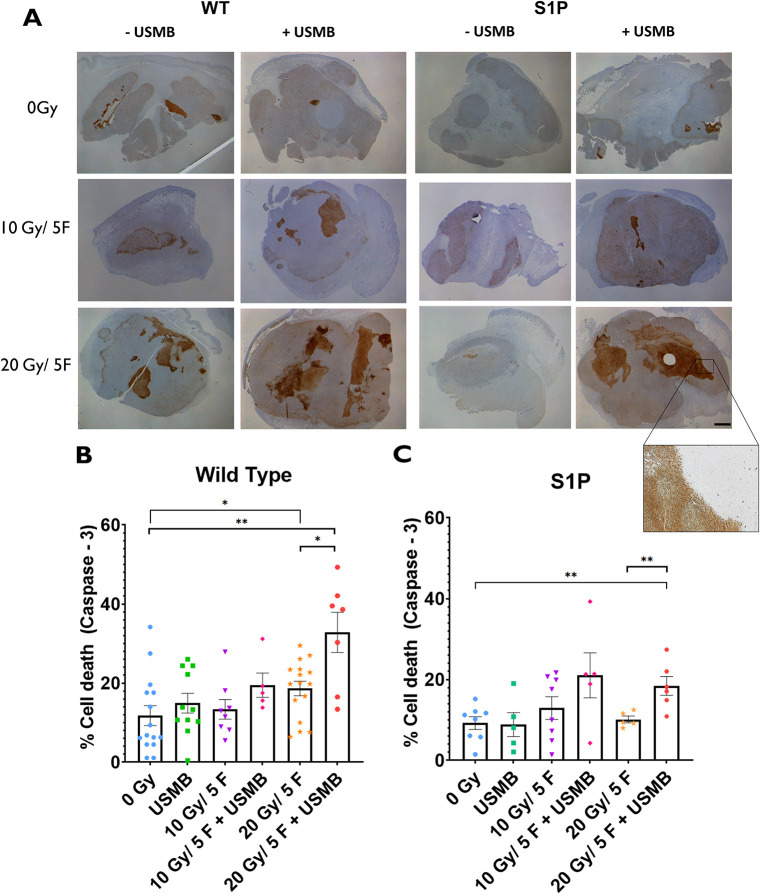
Fig. 2.
Tumour cell death within MCA/129 fibrosarcoma tumours post radiation treatment in WT and S1P-treated mice. (A) Immunohistochemistry staining for caspase-3 visualized whole areas of cell death within MCA/129 mouse fibrosarcoma tumours in WT or S1P treated mice. A dissection microscope at a 0.8× magnification was used to capture whole-tumour slices. Scale bar: 2 mm. (B,C) Whole-area staining was measured as total percentage of cell death detected in WT (B) and S1P-treated (C) groups. For WT mice: 0 Gy (n=15), 10 Gy/5F (n=8), 20 Gy/5F (n=16), USMB only (n=11), 10 Gy/5F+USMB (n=5), 20 Gy/5F+USMB (n=7). For S1P-treated mice: 0 Gy (n=8), 10 Gy/5F (n=8), 20 Gy/5F (n=5), USMB only (n=5), 10 Gy/5F+USMB (n=5), 20 Gy/5F+USMB (n=6). Error bars represent mean±s.e.m. Statistical analysis by Welch's two-tailed unpaired t-test. *P<0.05; **P<0.005.

