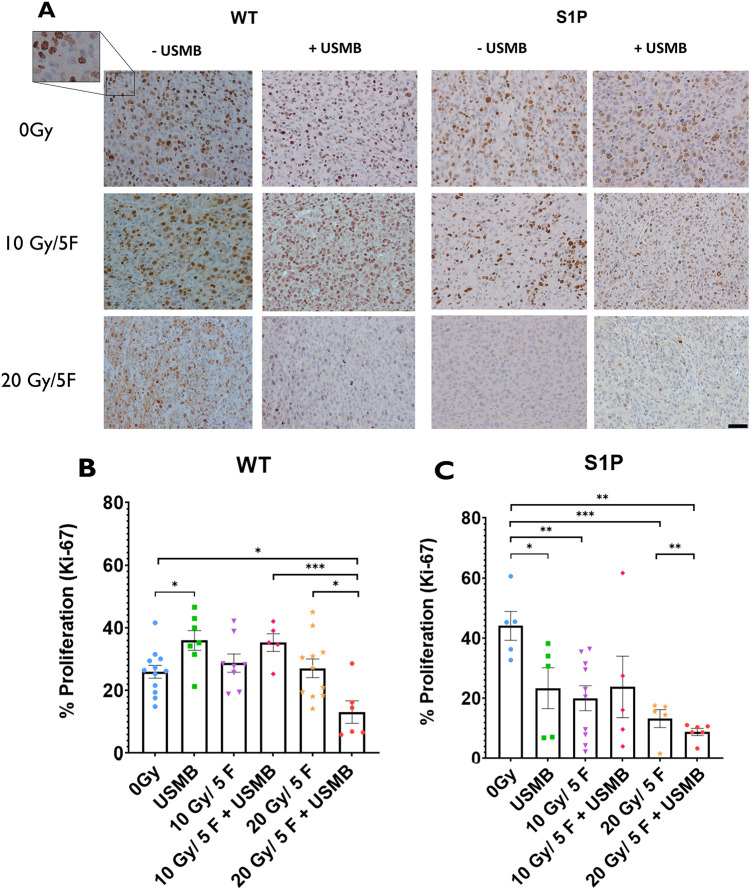
Fig. 3.
Cell proliferation index within MCA/129 fibrosarcoma tumours post radiation treatment in WT and S1P-treated mice. (A) Anti-Ki-67 antibody staining of proliferating primary tumour cells allowed for visualization of MCA/129 mouse fibrosarcoma tumours in WT or S1P-treated mice. Scale bar: 20 μm. (B,C) The numbers of individual cells of stained areas were calculated as a percentage of actively proliferating cells against the total cell count under a 20× objective lens of WT (B) and S1P-treated (C) groups. For WT mice: 0 Gy (n=12), 10 Gy/5F (n=8), 20 Gy/5F (n=11), USMB only (n=17), 10 Gy/5F+USMB (n=5), 20 Gy/5F+USMB (n=6). For S1P-treated mice: 0 Gy (n=5), 10 Gy/5F (n=10), 20 Gy/5F (n=5), USMB only (n=5), 10 Gy/5F+USMB (n=5), 20 Gy/5F+USMB (n=6). Error bars represent mean±s.e.m. Statistical analysis by Welch's two-tailed unpaired t-test. *P<0.05; **P<0.005; ***P<0.0005.

