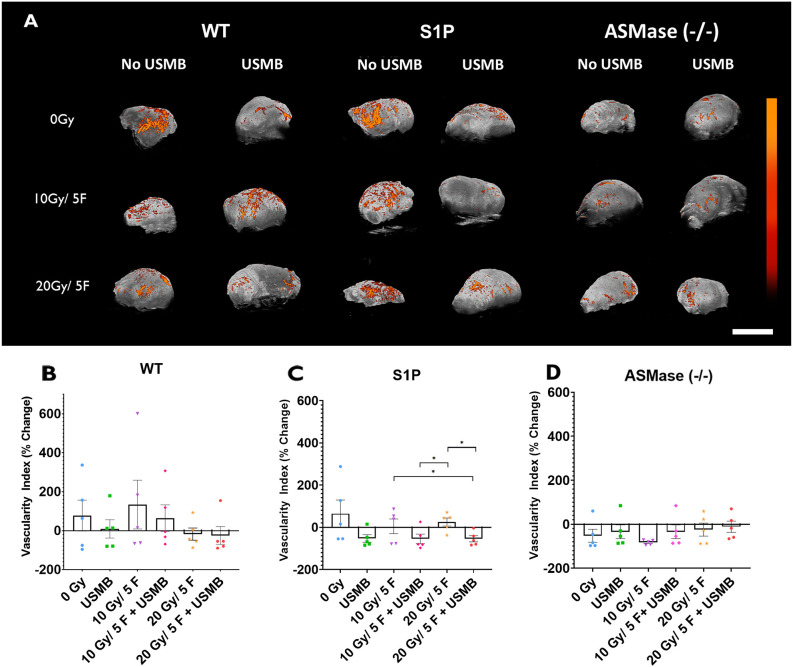
Fig. 7.
Power Doppler analysis of tumours treated with fXRT and/or USMB. (A) Maximum-intensity projections of power Doppler (PD) signals within a 3D volumetric tumour scan of whole tumours undergoing the indicated treatments. The colour bar represents a range from 11 dB (black) to 30 dB (orange). Scale bar: 1 cm. (B-D) Percentage change of the vascular index signal in each treatment condition for the WT, S1P-treated and ASMase−/− groups. Each cohort had five mice. Results are represented as signal intensity change from baseline pre-treatment scan. Error bars represent mean±s.e.m. Statistical analysis by Welch's two-tailed unpaired t-test. *P<0.05.

