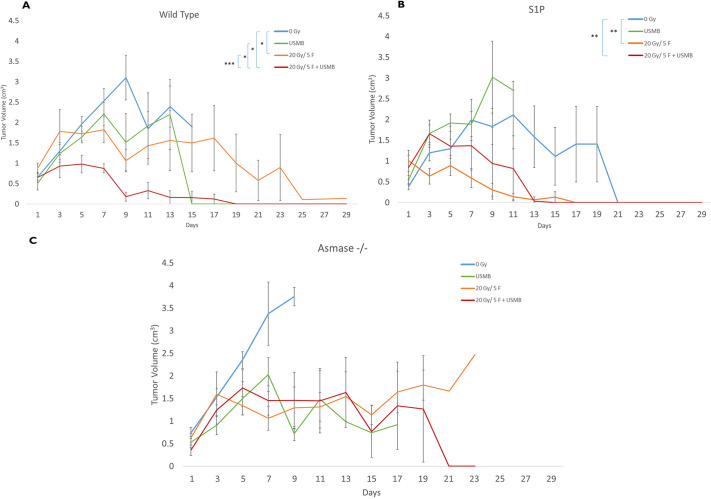
Fig. 8.
Tumour growth curves over the course of 29 days. Mice were treated on days 1-5 and were observed over the course of 29 days to observe tumour growth. (A) WT cohorts. (B) WT mice treated with S1P prior to fXRT or USMB treatments. (C) Mice with ASMase−/− genotype. For WT mice: 0 Gy (n=11), 20 Gy/5F (n=5), USMB only (n=5), 20 Gy/5F+USMB (n=5). For S1P-treated mice: 0 Gy (n=9), 20 Gy/5F (n=5), USMB only (n=3), 20 Gy/5F+USMB (n=5). For ASMase−/− mice: 0 Gy (n=5), 20 Gy/5F (n=5), USMB only (n=6), 20 Gy/5F+USMB (n=5). Error bars represent mean±s.e.m. Time points for which no error bars are present are points for which there was only one animal remaining for observation. Statistical analysis by Wilcoxon's two-tailed unpaired t-test. *P<0.05; **P<0.005; ***P<0.0005.

