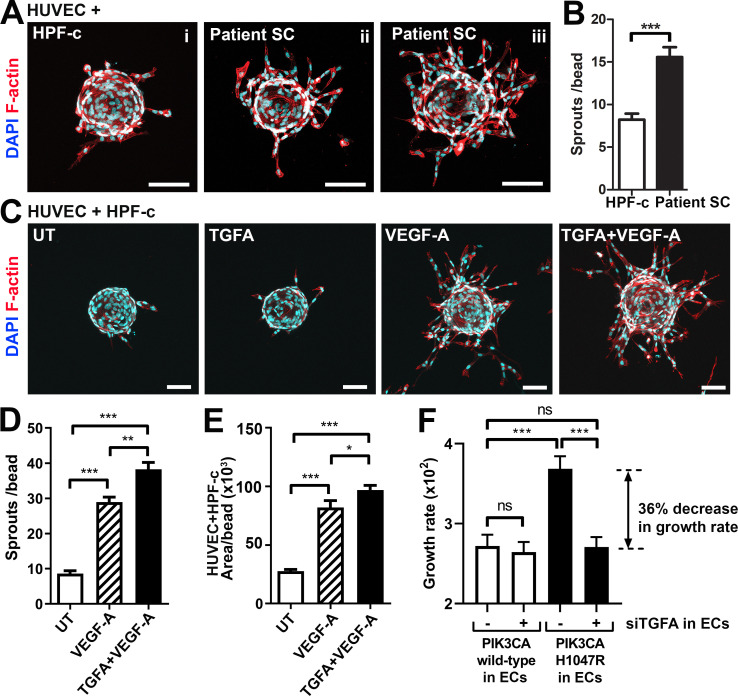
Figure 4. Patient stromal cells (SCs) and transforming growth factor A (TGFA) induce an angiogenic endothelial cell (EC) phenotype together with VEGF-A.
(A–B) Venous malformation (VM) patient SCs induce sprouting of genotypically normal ECs. HUVECs on collagen-coated beads were embedded into a fibrin gel and patient SCs or control HPF-c cells were put on top. Representative images are presented at d7. ECs are labeled with phalloidin (red). nuclei with DAPI (blue; A) The number of sprouts per bead in each condition is shown (B). Two independent experiments were done in triplicates. Two-tailed Mann-Whitney U test (data not normally distributed). *p<0.05. In all images, scale bar is 100 µm. (C–E) Fibrin bead assay with HUVECs and HPF-c cells shows increased EC sprouting after stimulation with rhVEGF-A and rhTGFA at d6. ECs are labeled with phalloidin (red), and nuclei with DAPI (blue; C). The number of sprouts per bead (D) or sprout area (E) in each condition was determined from confocal images by ImageJ (45 beads/group). 2 independent experiments were done in triplicates. Brown-Forsythe and Welch ANOVA with Dunnet T3 post-hoc test (D) or Kruskal-Wallis test with two-stage step-up method of Benjamini, Krieger and Yekutieli to control FDR (E). ***p<0.001. (F) Co-culture experiments with HPF-c and HUVEC cells showed an increased growth rate in wells with PIK3CAH1047R-expressing ECs in comparison to wells with ECs expressing PIK3CAwt. The response was abolished after inhibition of endogenous TGFA in ECs by specific siRNA, demonstrating the involvement of TGFA in PIK3CAH1047R-induced responses. Wells with siCtrl-transduced ECs (marked to be negative for siTGFA) were used as a control group in the experiments. Cellular growth was monitored using IncuCyte Live-Cell Imaging system. Data are presented as relative growth rate from two experiments done in triplicates. One-way ANOVA with Bonferroni or Sidac post-hoc test. ***p<0.001. In all data, mean and SEM are presented.


