. 2023 May 26;12:e84645. doi: 10.7554/eLife.84645

Figure 4. Protein–lipid interactions of the JAK2-FERM-SH2 PRLR-ICDLID1 complex obtained from coarse-grained (CG)-molecular dynamic (MD) simulations.

(A) Schematic representation of the simulated system. Combined (B) JAK2-FERM-SH2-lipid and (C) PRLR-ICDLID1-lipid contact frequency histograms for the 16 CG simulations of the JAK2-FERM-SH2+PRLR-ICDLID1+POPC:POPS:PI(4,5)P2 system. (D) Distribution of the orientations adopted by the JAK2-FERM-SH2+PRLR-ICDLID1 complex when bound to lipids taken from the 16 simulations with POPC:POPS:PI(4,5)P2 in the lower-leaflet. The snapshots surrounding the map correspond to representative conformations of the highlighted states also indicating the fraction total bound time for which each state was observed. Representative conformations of (E) State 2 and (F) State 4. The gray cylinder depicts the position where PRLR-transmembrane domain (TMD) should be located. Representative protein–lipid contact histograms for (G) State 2 and (H) State 4 colored as in panels B and C. POPC, 1-palmitoyl-2-oleoyl-sn-glycero-3-phosphocholine; POPS, 1-palmitoyl-2-oleoyl-sn-glycero-3-phospho-L-serine.

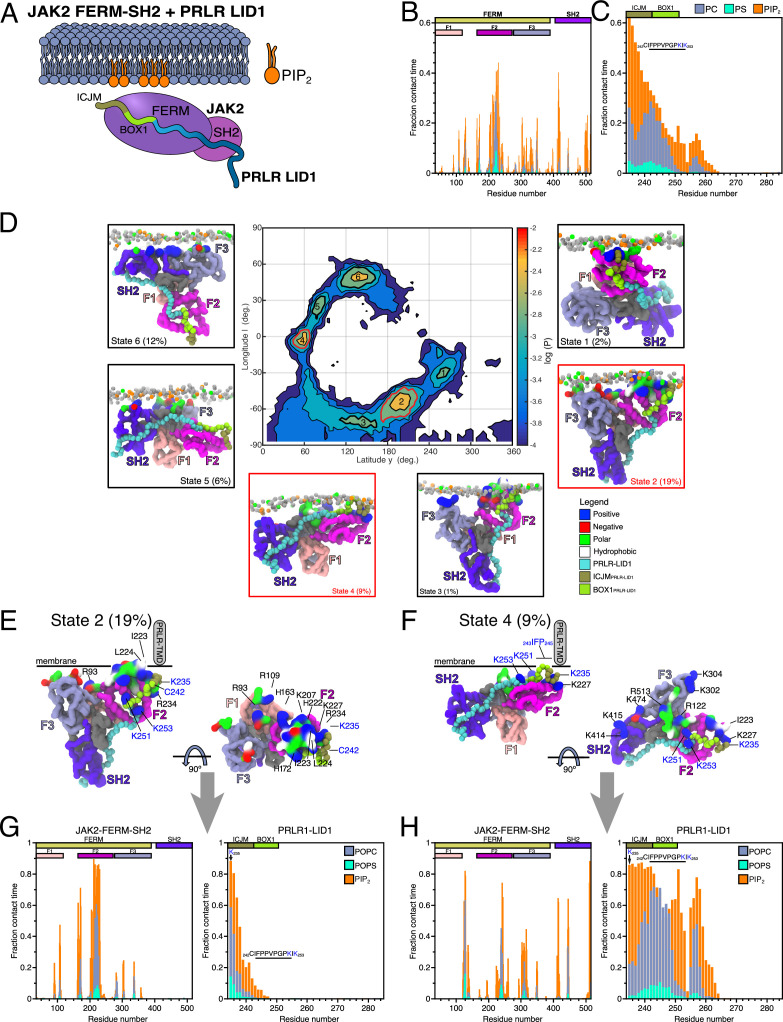
Figure 4.

Figure 4—figure supplement 1. Analysis of the JAK2-FERM-SH2- PRLR-ICDK235-H300 all atom MD simulation.

Figure 4—figure supplement 1.

(A) Average distance map between JAK2-FERM-SH2 and PRLR-ICDK235-H300 obtained from the all-atom molecular dynamic (MD) simulation. (B) Conservation of residues from prolactin receptor (PRLR) in contact with JAK2-FERM-SH2 (see A). Residues with green label correspond to BOX1. (C–D) Conservation JAK2-FERM-SH2 oriented as state 2 (see Figure 4E). Labeled residues correspond to residues that contact PRLR (see A) or that contact the lipids on states 2 and 4 (see Figure 4E–H).
Figure 4—figure supplement 2. Complementary analysis of protein–lipid interactions of the JAK2-FERM-SH2 PRLR-intracellular domain (ICD)K235-H300 complex obtained from coarse-grained (CG)-molecular dynamic (MD) simulations.

Figure 4—figure supplement 2.

(A) Number of simulations where protein is bound to the lower-leaf of the bilayer for the simulations containing: the JAK2-FERM-SH2+PRLR-ICDK235-H300 complex near a POPC:POPS(70:30) bilayer (blue line) and the JAK2-FERM-SH2+PRLR-ICDK235-H300 complex (red line) and the apo JAK2-FERM-SH2 (orange line)near a POPC:POPS:PI(4,5)P2 (80:10:10) bilayer. (B–C) Distribution of the orientations adopted by (B) the JAK2-FERM-SH2+PRLR-ICDK235-H300 complex when bound to lipids taken from the simulations with POPC:POPS(70:30) in the lower-leaflet and (C) the apo JAK2-FERM-SH2 when bound to lipids taken from the simulations with POPC:POPS:PI(4,5)P2 (80:10:10) in the lower-leaflet. (D–E) Representative protein–lipid contact histograms for State 1 observed for the JAK2-FERM-SH2+PRLR- ICDK235-H300 complex near a POPC:POPS(70:30) bilayer. (F–H) Representative protein–lipid contact histograms for States 1, 2, and 3 observed for the apo JAK2-FERM-SH2 near a POPC:POPS:PI(4,5)P2 (80:10:10) bilayer. POPC, 1-palmitoyl-2-oleoyl-sn-glycero-3-phosphocholine; POPS, 1-palmitoyl-2-oleoyl-sn-glycero-3-phospho-L-serine.
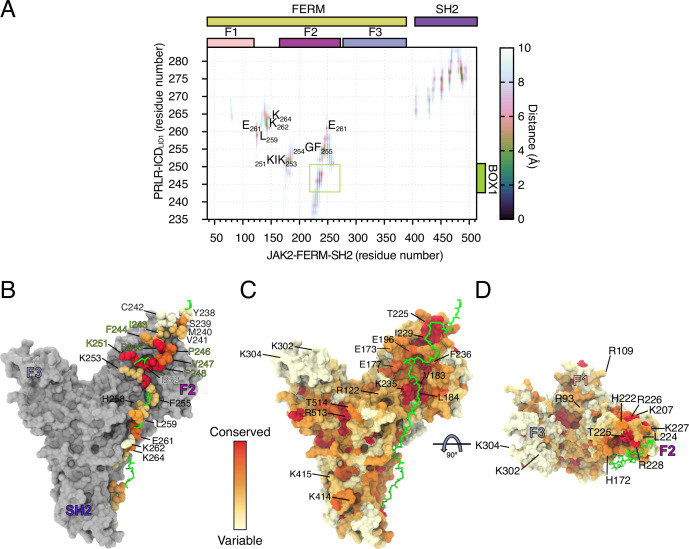
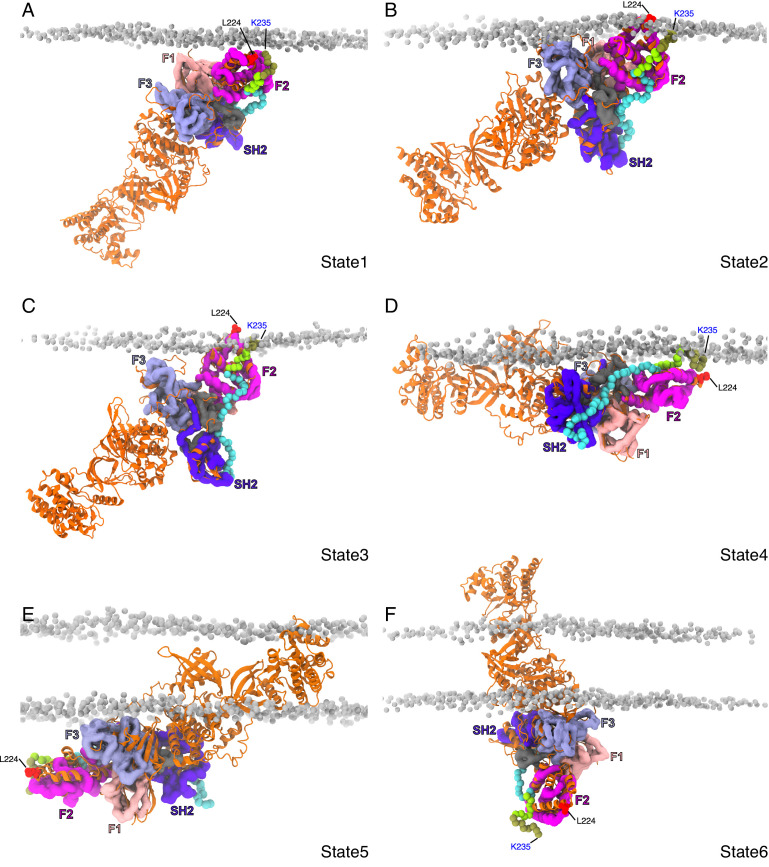
Figure 4—figure supplement 3. Snapshots of the different binding states observed for the JAK2-FERM-SH2 – prolactin receptor (PRLR)-intracellular domain (ICD)K235-H300 complex with the complete structural model of JAK2 (obtained from AF2-EBI database).

Figure 4—figure supplement 3.

In each panel, the coarse-grained (CG) JAK2-FERM-SH2 – PRLR-ICDK235-H300 complex is depicted and colored as in Figure 4. The full-length JAK2 model is shown in cartoon representation colored orange near a POPC:POPS(70:30) bilayer. (F–H) Representative protein–lipid contact histograms for States 1, 2, and 3 observed for the apo JAK2-FERM-SH2 near a POPC:POPS:PI(4,5)P2 (80:10:10) bilayer. POPC, 1-palmitoyl-2-oleoyl-sn-glycero-3-phosphocholine; POPS, 1-palmitoyl-2-oleoyl-sn-glycero-3-phospho-L-serine.
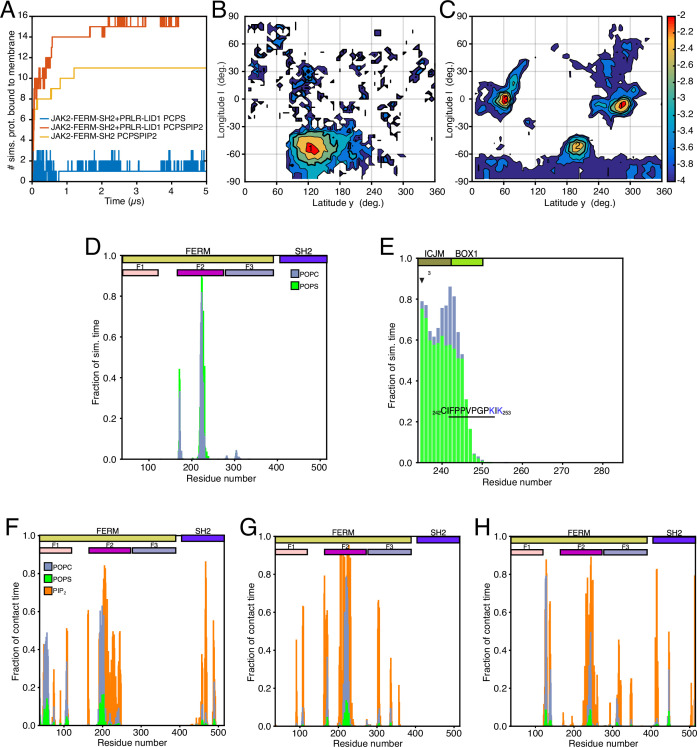
Figure 4—video 1. Y State (STATE 2) from the JAK2-FERM-SH2 PRLR-intracellular domain (ICD)K235-E284 complex simulated near a bilayer containing PI(4,5)P2: Representative trajectory showing State 2 (Y).
Download video file (10.4MB, mp4)
Protein and lipids colored as in Figure 4.
Figure 4—video 2. FLAT State (STATE 4) from the JAK2-FERM-SH2 PRLR-intracellular domain (ICD)K235-E284 complex simulated near a bilayer containing PI(4,5)P2: Representative trajectory showing State 4 (Y).
Download video file (10.9MB, mp4)
Protein and lipids colored as in Figure 4.