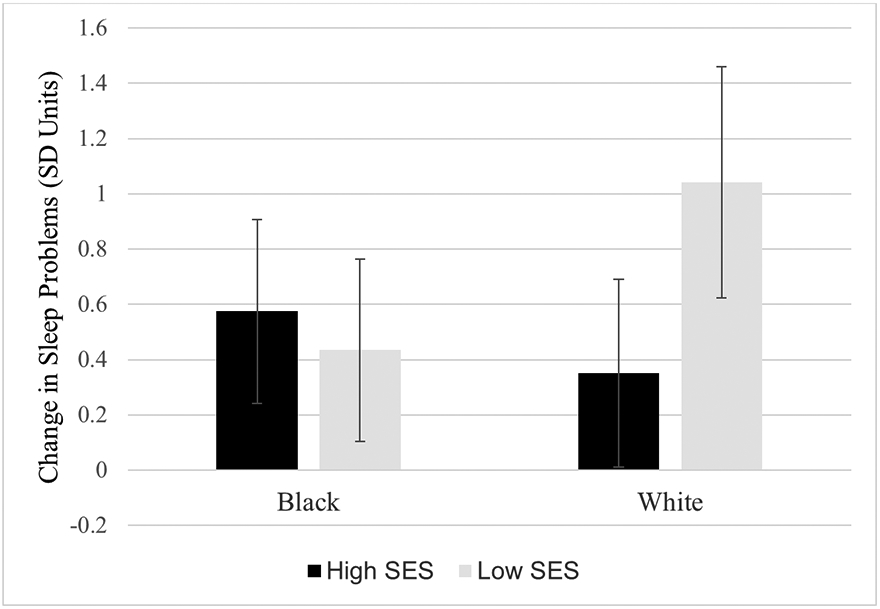
Figure 1.

Fitted interaction plot showing the magnitude of change in sleep problems (PSQI global score) by race and socioeconomic status (SES). Values are derived from Model 3 with non-significant interaction effects removed. Error bars reflect 95% confidence intervals. Low SES is defined as 1 SD below the mean, equivalent to a score of 2.4 on the 0 to 4 scale. High SES is defined as .73 SD units above the mean, equivalent to a score of 4 (highest possible value).
