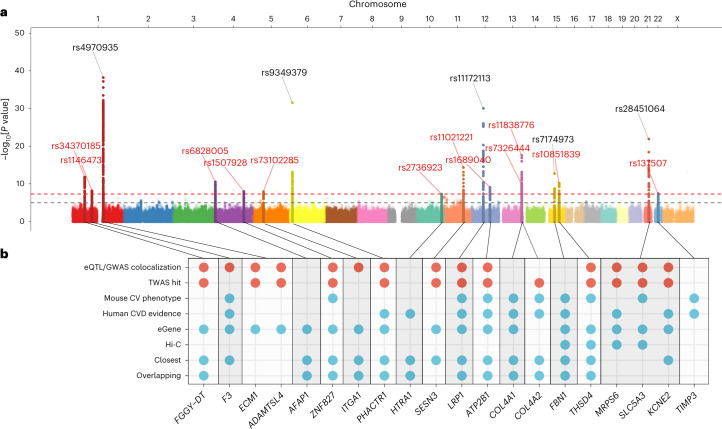
Fig. 1. GWAS meta-analysis main association results and gene prioritization at-risk loci.
a, Manhattan plot representation of SNP-based association meta-analysis in SCAD. The x axis shows the genomic coordinates and the y axis shows the −log10[P value] obtained by two-sided Wald test. SNPs located around genome-wide significant signals (±500 kb) are highlighted. The labels show the rsIDs for the lead SNPs, with newly identified loci in red and previously known loci in black. The dashed red line represents genome-wide significance (P = 5 × 10⁻⁸) and the gray line suggestive association (P = 10−5). b, Summary of the strategy for the annotation of gene prioritization. The dots indicate genes fulfilling one of the following eight criteria: (1) colocalization of SCAD association signal and eQTL association in the aorta, coronary artery, tibial artery, fibroblasts or whole blood samples (GTEx version 8 release); (2) a TWAS hit in any of the above-mentioned tissues; (3) a cardiovascular (CV) phenotype in the gene knockout mouse; (4) existing evidence of gene function in cardiovascular disease (CVD) pathophysiology in humans; (5) the gene is an eGene for a nearby lead SNP in the above-mentioned GTEx tissues; (6) Hi-C evidence25 for a promoter of the gene in a chromatin loop from human aorta tissue that includes variants from the credible set of causal variants; (7) the closest gene upstream or downstream from the lead SNP; or (8) variants in the credible set of causal variants map in the gene. Criteria 1 and 2 (blue dots) were given a tenfold weighted score over criteria 3–8. Genes with the most criteria were prioritized in each locus and are shown here.

