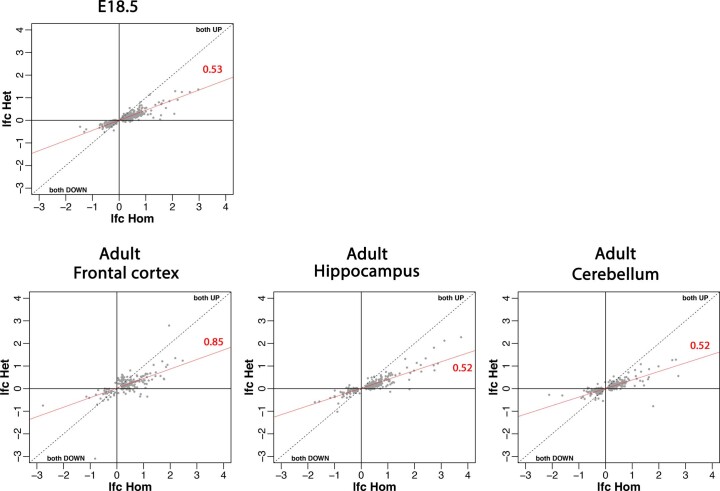
Extended Data Fig. 5. Correlation in differential gene expression between heterozygous and homozygous Kdm5b mutant mice.
Log2-fold change of differentially expressed genes plotted for Kdm5b+/− (y-axis) and Kdm5b−/− (x-axis) mice across embryonic and adult brain tissues as indicated. There is a strong correlation between direction of change in expression in both mutant genotypes (robust linear regression line and slope shown in red).

