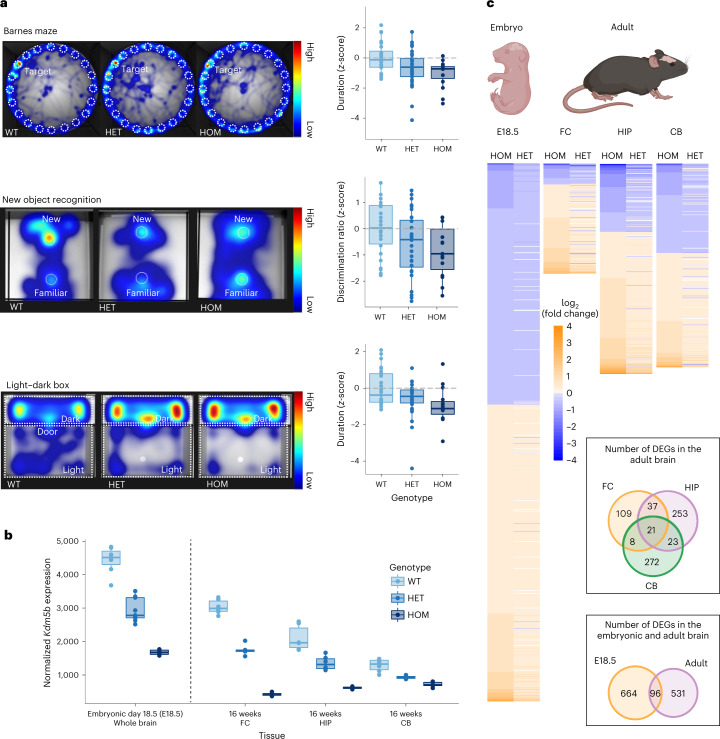
Fig. 4. Kdm5b LoF alleles display a gene dosage effect on behavioral, cognitive and molecular phenotypes in mice.
a, Mice carrying Kdm5b LoF alleles showed a dose-dependent decrease in spatial memory performance (Barnes maze; two-sided Wald test based on an additive genetic effect with P = 0.012; Kdm5b+/− n = 34 (P = 0.031) and Kdm5b−/− n = 15 (P = 0.005) mice spent less time around the goalbox than WT controls, n = 24); showed a dose-dependent decrease in object recognition memory performance (new object recognition; two-sided Wald test based on an additive genetic effect with P = 0.042; Kdm5b+/− n = 32 (P = 0.038) and Kdm5b−/− n = 15 (P = 0.011) mice had reduced discrimination compared to WT controls, n = 26); and showed a dose-dependent increase in anxiety-related behavior (light–dark box; two-sided Wald test based on an additive genetic effect with P = 0.008; Kdm5b+/− n = 15 (P = 0.025) and Kdm5b−/− n = 34 (P = 0.004) mice spent less time in the light compared to WT controls). P values are based on two-sided Wald tests from a double generalized linear model (dglm v.1.8.5). For the box plot, the center line represents the median, the box limits represent the interquartile range (IQR) and the whiskers indicate the minimum and maximum values. The heatmaps show the relative time spent around various arenas during the trial period of each assay, as a composite of all mice of the same genotype (Barnes maze and light–dark box) or the trace for a single representative animal (new object recognition). Kdm5b+/− (HET) and Kdm5b−/− (HOM) mice spent less time around the goalbox (Barnes maze), showed reduced discrimination of the new object (new object recognition) and spent more time in the dark zone (light–dark box) compared with WT controls. b, Normalized RNA-seq read counts of Kdm5b gene expression in WT, Kdm5b+/− and Kdm5b−/− mice across embryonic and adult tissues as indicated (n = 7 for WT, n = 7 for Kdm5b+/− HET and n = 8 for Kdm5b−/− HOM embryonic mice whole brain; n = 6, 5 and 6 for the FC of WT, HET and HOM adult mice; n = 6, 6 and 6 for the HIP of WT, HET and HOM adult mice; n = 6, 6 and 6 for the CB of WT, HET and HOM adult mice). For the box plot, the center line represents the median, the box limits represent the IQR and the whiskers indicate the minimum and maximum values. c, Heatmap of expression changes (log2 fold change) in DEGs in Kdm5b+/− (HET) and Kdm5b−/− (HOM) mice across embryonic and adult tissues as indicated. There is a strong correlation between direction of change in expression in both mutant genotypes. The Venn diagrams show the overlap of DEGs in both Kdm5b+/− and Kdm5b−/− mice across tissues and stages. Created with BioRender.com.

