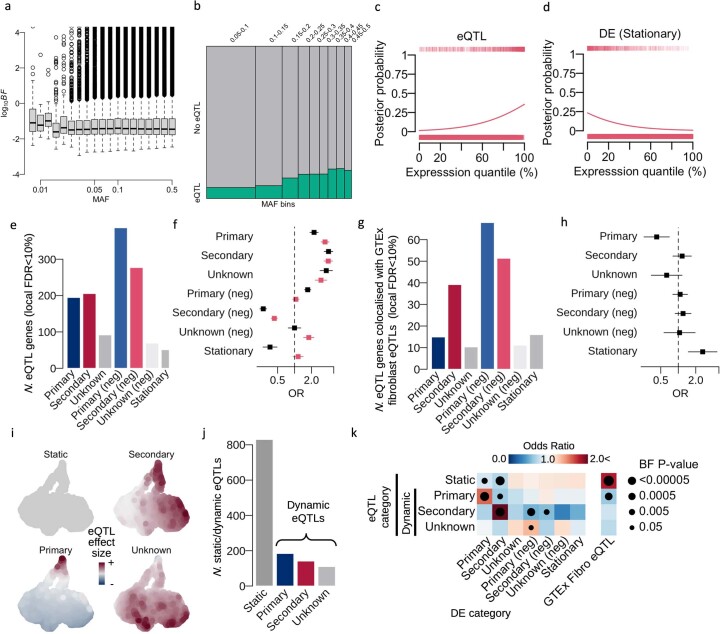
Extended Data Fig. 4. Characteristics of mapped response eQTLs.
a. Distributions of Bayes factors from our fibroblast data for N = 1 million random gene-variant pairs. Here we used all variants with MAF > 0% for the Bayes factor calculation (not only variants with MAF > 5%). Here The bottom and top of each box (Q1 and Q3) are the 25th and 75th percentile (the lower and upper quartiles, respectively), and the band near the middle of the box is the 50th percentile (the median). The ends of the whiskers are defined as follows: upper whisker = min(max value, Q3 + 1.5*IQR) and lower whisker = max(min value, Q1–1.5*IQR), where IQR = Q3-Q1 is the box length. b. Mosaic plot shows the number of eQTLs (local FDR = 10%) in different MAF bins (column). We included the number of non-eQTL (the top row of the plot coloured by gray) in comparison to the number of eQTLs (bottom row coloured by green). c-d. The trend of posterior probabilities of eQTLs or stationary genes (one of the 7 differential expression categories) against gene expression levels. The line was estimated using logistic regression where the response variable is the posterior probability greater than 0.9 against the expression quantile based on the average expression across all cells for each gene. e. The number of eQTL genes stratified by the spatial DE genes demonstrated in Extended Data Fig. 2d. f. Forest plot showing the enrichment of the 1,275 eQTL genes in each of the 7 DE categories. The black dots show non-adjusted eQTL enrichment, and the red dots show the enrichment following adjustment for gene expression levels (Online Methods). The error bars in the forest plot show 95% confidence intervals (standard errors) of odds ratios using N = 10,748 genes as independent samples (see Online Methods for details). g. The number of eQTL genes colocalised with GTEx fibroblast eQTLs in the 7 different DE gene categories. h. Forest plot shows the enrichment of the eQTL colocalised with GTEx fibroblast eQTLs in the 7 different DE gene categories. The error bars in the forest plot show 95% confidence intervals (standard errors) of odds ratios using N = 10,748 genes as independent samples (see Online Methods for details). i. UMAPs showing spatial distributions of eQTL effect sizes estimated from the GP mixture model with 4 different spatial eQTL categories (static, primary, secondary and unknown; Online Methods). UMAP coordinates are identical to Fig. 2a. j. The numbers of static and dynamic eQTLs estimated from the GP mixture model. k. Heatmap showing the enrichment of spatial eQTL categories for the 7 DE categories and the GTEx fibroblast eQTLs. Colour scale shows the odds ratio of enrichment and the size of dots denotes the magnitude of Bonferroni-corrected P-values of the enrichment. The odds ratios and corresponding P-values (from a one-sided Chi-square test) were computed using N = 10,748 genes as independent samples (see Online Methods for details). Dots with P > 0.05 were omitted.

