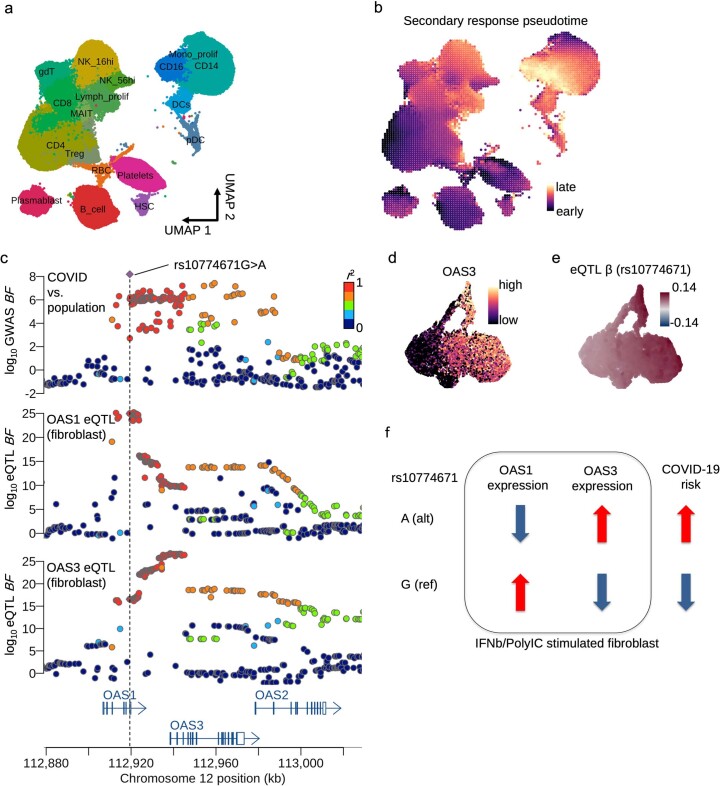
Extended Data Fig. 7. Fine-mapping OAS locus.
a. UMAP shows the 18 different cell types annotated previously in the PBMC data22. b. UMAP shows the secondary response pseudotime calculated from the secondary response genes discovered in the fibroblast data. c. Locus zoom plot shows the COVID-19 GWAS, OAS1 and OAS3 eQTL (both in fibroblasts) associations. UMAP coordinates are identical to Extended Data Fig. 7a. d. UMAP shows the OAS3 gene expression. UMAP coordinates are identical to Fig. 2a. e. UMAP shows the eQTL effect size at rs10774671. UMAP coordinates are identical to Fig. 2a. f. Effect directions of OAS1/3 eQTLs and the risk allele of COVID-19 GWAS at the lead variant rs10774671.

