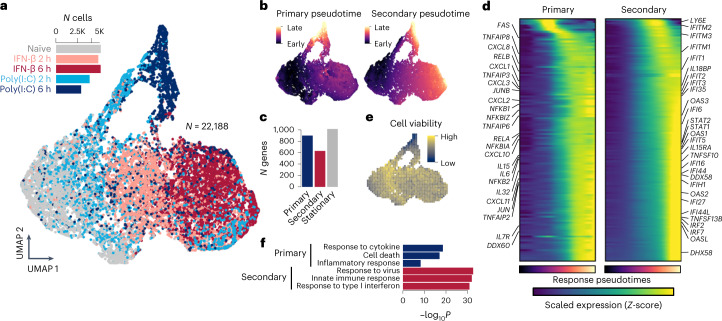
Fig. 2. Innate immunity captured by GPLVM and GP mixture model.
a, UMAP of latent variables capturing innate immune variation between cells. Cells are colored by the five experimental time points (gray, naïve state; pink, IFN-β 2 h; brown, IFN-β 6 h; blue, Poly(I:C) 2 h; navy, Poly(I:C) 6 h). b, Estimated pseudotime for primary and secondary responses using the GP mixture model. UMAP coordinates are identical to a. c, Barplot shows the numbers of response and stationary genes. d, Heatmaps show dynamic gene expression changes along primary or secondary response pseudotime. The pseudotime color scale corresponds to b. The expression color (navy to yellow) shows the magnitude of scaled expression for each gene (Z-score). e, UMAP shows a predicted Achilles cell viability using CEVIChE (Methods). UMAP coordinates are identical to a. f, Barplot shows the enrichment of gene ontology terms for primary and secondary genes. P values were computed using Fisher’s one-tailed test with Bonferroni multiple testing correction implemented in gprofiler2 on R. K, thousand.

