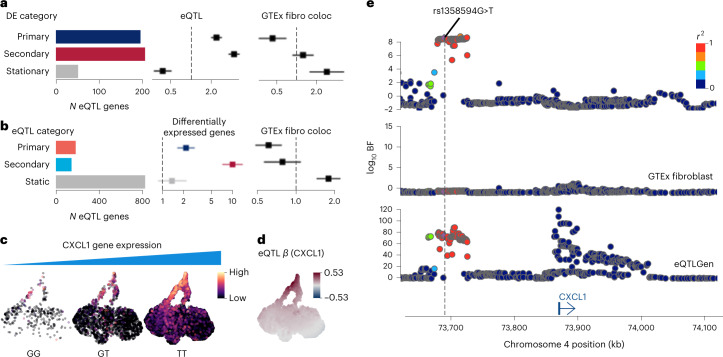
Fig. 3. Characteristics of response eQTLs mapped using GP regression.
a, Barplot showing the numbers of eQTLs (local FDR < 10%) that are primary and secondary response genes or stationary genes. Forest plots showing the enrichment of discovered eQTLs for the DE categories and GTEx fibroblast eQTL colocalizations. The error bars in the forest plots show 95% confidence intervals (standard errors) of odds ratios using N = 10,748 genes as independent samples (Methods). b, Barplot showing the numbers of static and dynamic eQTLs (primary and secondary response eQTLs). Forest plots showing the enrichment of response eQTLs for differentially expressed genes (primary, secondary response and static eQTLs for primary and secondary response genes, and for stationary genes, respectively) and the enrichment of response eQTLs of GTEx fibroblast eQTL colocalization. The error bars in the forest plots show 95% confidence intervals (standard errors) of odds ratios using N = 10,748 genes as independent samples (Methods). c, UMAPs showing CXCL1 expression levels stratified by different genotype groups at rs1358594G>T. UMAP coordinates are identical to Fig. 2a. d, UMAP shows the distribution of eQTL effect size (β) at rs1358594. The alternative allele (T) is assessed. UMAP coordinates are identical to Fig. 2a. e, Locus zoom plot of CXCL1 eQTL association Bayes factors around the CXCL1 gene (top, in-house data; middle, GTEx fibroblast eQTL; bottom, eQTLGen blood eQTL). BF, Bayes factor; fibro coloc, colocalisation with GTEx fibroblast eQTLs.

