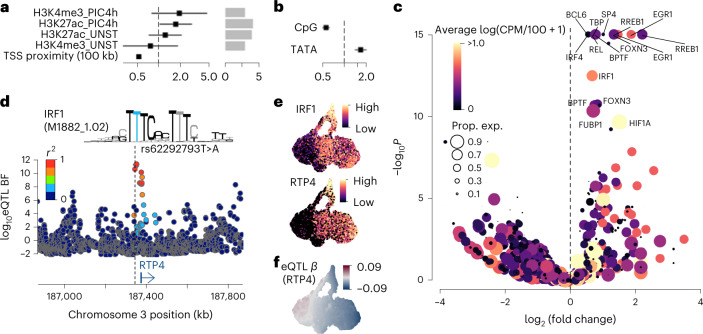
Fig. 4. Fine-mapping eQTLs with epigenetic data.
a, Enrichment eQTLs for regulatory regions characterized by ChIP–seq for the two histone modifications (H3K27ac and H3K4me3) under two different conditions (UNST, unstimulated; PIC4h, Poly (I:C) 4-h stimulation). The error bars in the forest plot show 95% confidence intervals (standard errors) of odds ratios using N = 10,748 genes as independent samples (Methods). b, eQTL enrichment for genes with TATA-box or CGI between TSS and 100 bp upstream. The error bars in the forest plots show 95% confidence intervals (standard errors) of odds ratios using N = 10,748 genes as independent samples (Methods). c, Enrichment of lead eQTL variants for various TF motifs. The color of each point shows the average expression across all cells and the point size shows the frequency of cells with CPM > 0 for each TF gene in our fibroblast data. d, Locus zoom plot showing the RTP4 eQTL association Bayes factors. The lead eQTL variant rs62292793T>A disrupts the putative IRF1 binding motif (M1882_1.02; CIS-BP v.1.02) upstream of the RTP4 gene. e, UMAPs showing expression levels of IRF1 and RTP4. UMAP coordinates are identical to Fig. 2a. f, UMAP showing eQTL effect size of RTP4. UMAP coordinates are identical to Fig. 2a. CPM, counts per million; Prop. exp., proportion of cells the gene expressed.

