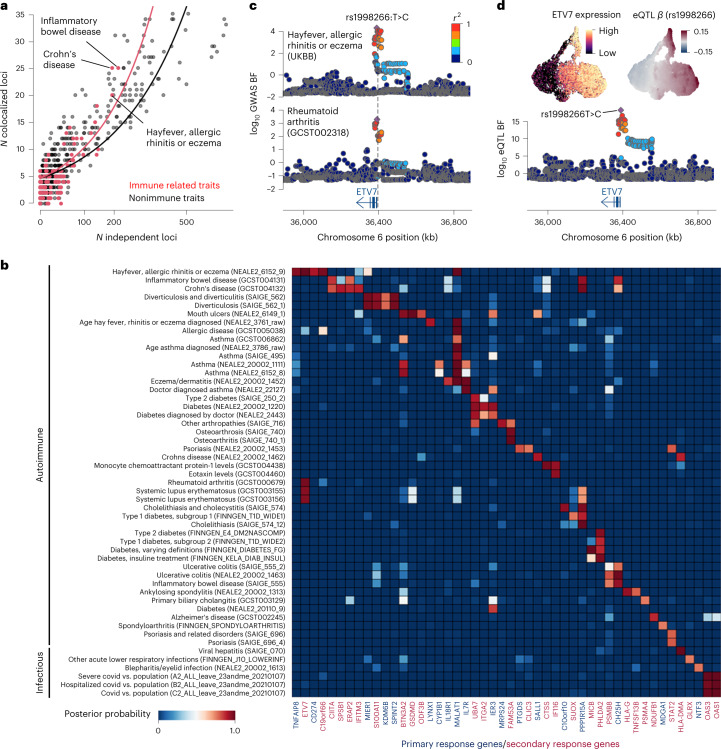
Fig. 5. eQTL and disease GWAS colocalization.
a, Scatter plot shows the number of colocalized eQTLs with posterior probability greater than 0.5 (y axis) against the number of independent loci where GWAS and eQTL do not share the putative causal variant (Methods). b, Heatmap shows the posterior probability of colocalization between eQTLs and GWAS loci. Only primary (colored by navy) and secondary (colored by red) response genes were shown. c, Locus zoom plots show the association of rheumatoid arthritis with hay fever, allergic rhinitis or eczema around the ETV7 gene. Points are colored by the linkage disequilibrium index (r2) with the GWAS index variant rs1008266T>C. d, UMAPs show the scaled ETV7 expression and the eQTL effect size (β) at the lead eQTL variant rs1998266T>C. Locus zoom plot shows the eQTL association for ETV7. UMAP coordinates are identical to Fig. 2a. UKBB, UK BioBank.

