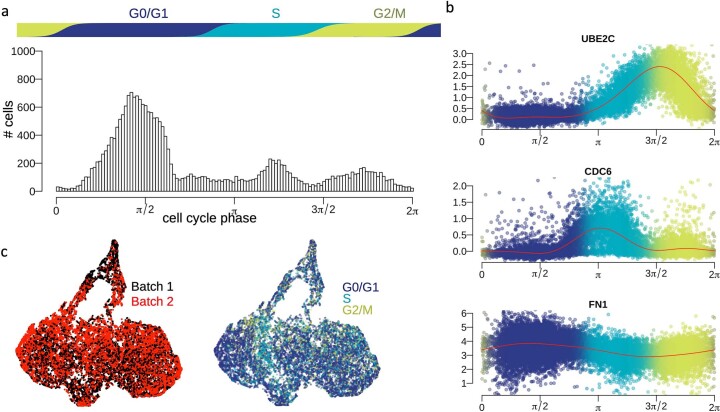
Extended Data Fig. 2. Observed cellular states in the fibroblast single cell data.
a. Histogram shows the distribution of estimated cell cycle phase by GPLVM (Online Methods). b. Scatterplots show scaled expression of known cell cycle genes (UBE2C and CDC6) and a gene highly expressed in G0/G1 phase (FN1). The red curves show the posterior mean estimates of expression levels by GPLVM (Online Methods). c. UMAPs of the target cell states coloured by unknown batch or cell cycle phase. UMAP coordinates are identical to Fig. 2a.

