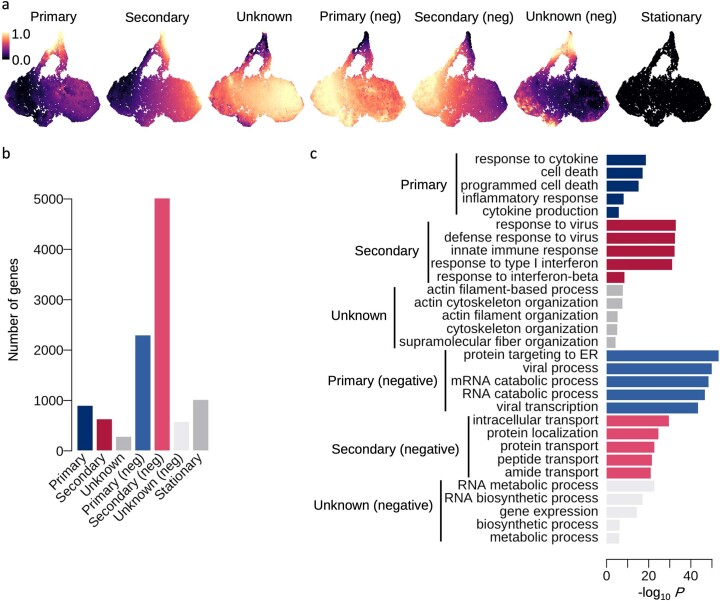
Extended Data Fig. 3. Spatial differential expression analysis to classify genes into different innate immune responses.
d. UMAPs of the seven different mixture components estimated from the GP mixture model (Online Methods). The values are quantile-normalised as in [0,1], and also treated as pseudotime for the first two components (primary and secondary). UMAP coordinates are identical to Fig. 2a. e. The number of genes categorised in each of the seven components. f. Top GO terms enriched with the genes detected in each of the seven DE categories.

