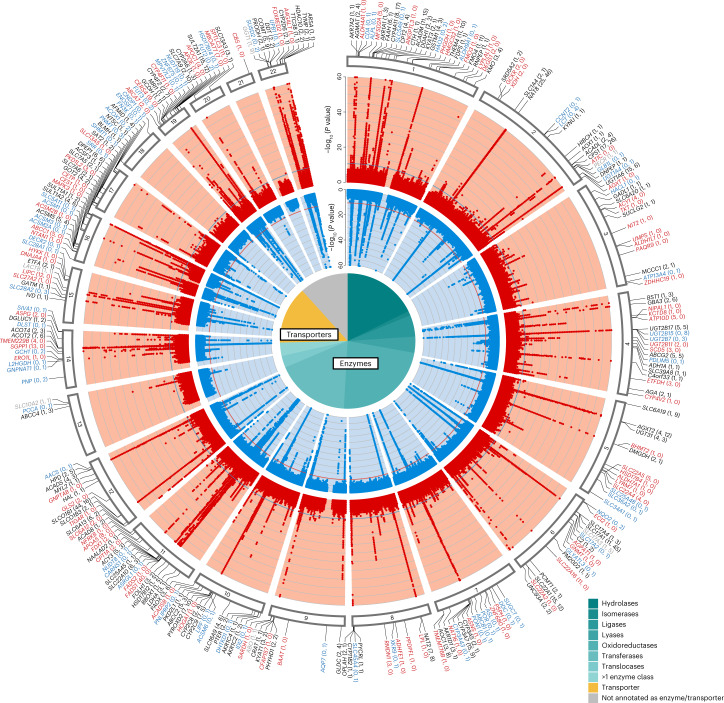
Fig. 2. Circular presentation of the 1,299 identified genetic associations with metabolite levels in plasma and urine.
The light red band shows the −log10 (P values) for genetic associations with metabolite levels in plasma by chromosomal position, and the light blue band shows the associations with metabolite levels in urine. Results from all 1,296 plasma and 1,401 urine GWAS traits are based on linear regressions and are overlaid in the respective bands, with P values truncated at 1 × 10−60. The horizontal lines (blue and red) indicate genome-wide significance (Pplasma = 3.9 × 10⁻¹¹ and Purine = 3.6 × 10⁻¹¹). Supplementary Table 3 contains details about index SNP associations (mQTLs). Gene labels for significant loci were assigned based on mQTL annotations, colocalization analysis with gene expression and protein levels, and literature research (Methods). Black gene labels indicate genetic regions identified in both plasma and urine with intermatrix colocalization (PP H4 > 0.8), gray labels indicate genetic regions identified in both plasma and urine without intermatrix colocalization, and red or blue labels indicate genetic regions exclusively identified in plasma or urine, respectively. The number of plasma and urine mQTLs annotated to a gene is given in parentheses (plasma, urine). The pie chart reflects the proportions of the 282 unique genes that were annotated as enzymes and transporters. Official gene symbols for PYCRL and ERO1L are PYCR3 and ERO1A, respectively.

