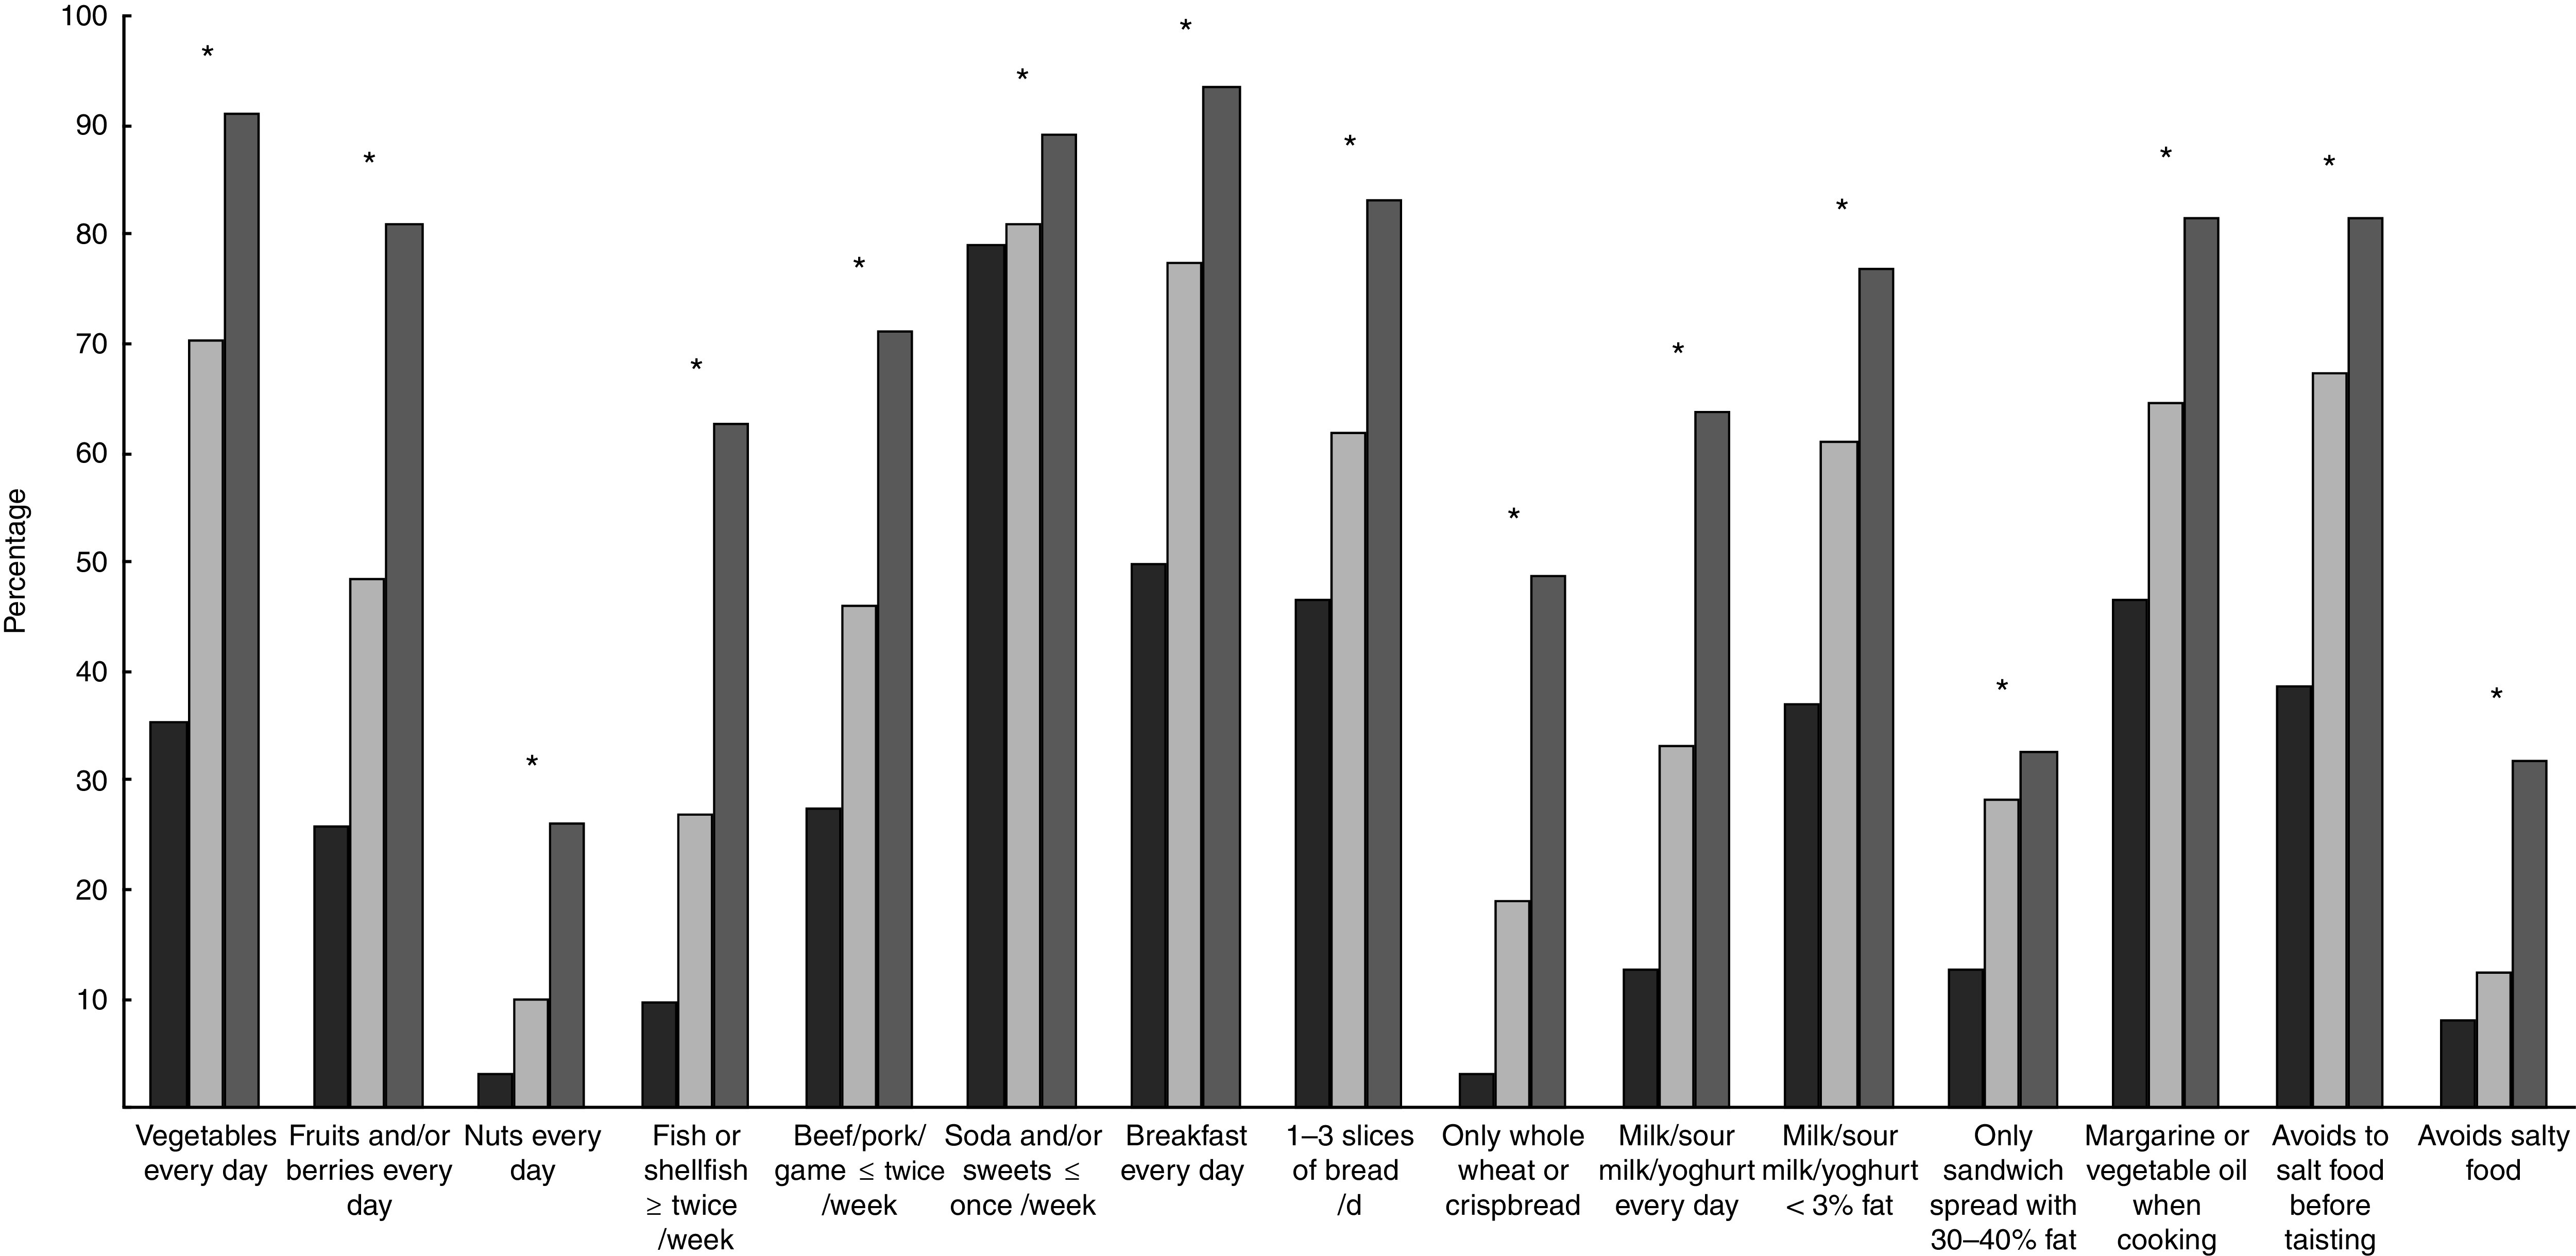
Fig. 2.

Percentage of participants in each dietary pattern group ( , poor;
  , average;
  , good) who were considered to meet the recommendations for each item among 50-year-old men and women born in 1963 and living in Gothenburg, Sweden, 2013. Differences between groups were measured with χ
2 tests: *P<0·05 (pairwise difference between the groups are presented in the online supplementary material, Supplemental Table 1). Good diet meets nine or more recommendations; average diet meets six to eight recommendations; and poor diet meets five or fewer recommendations
