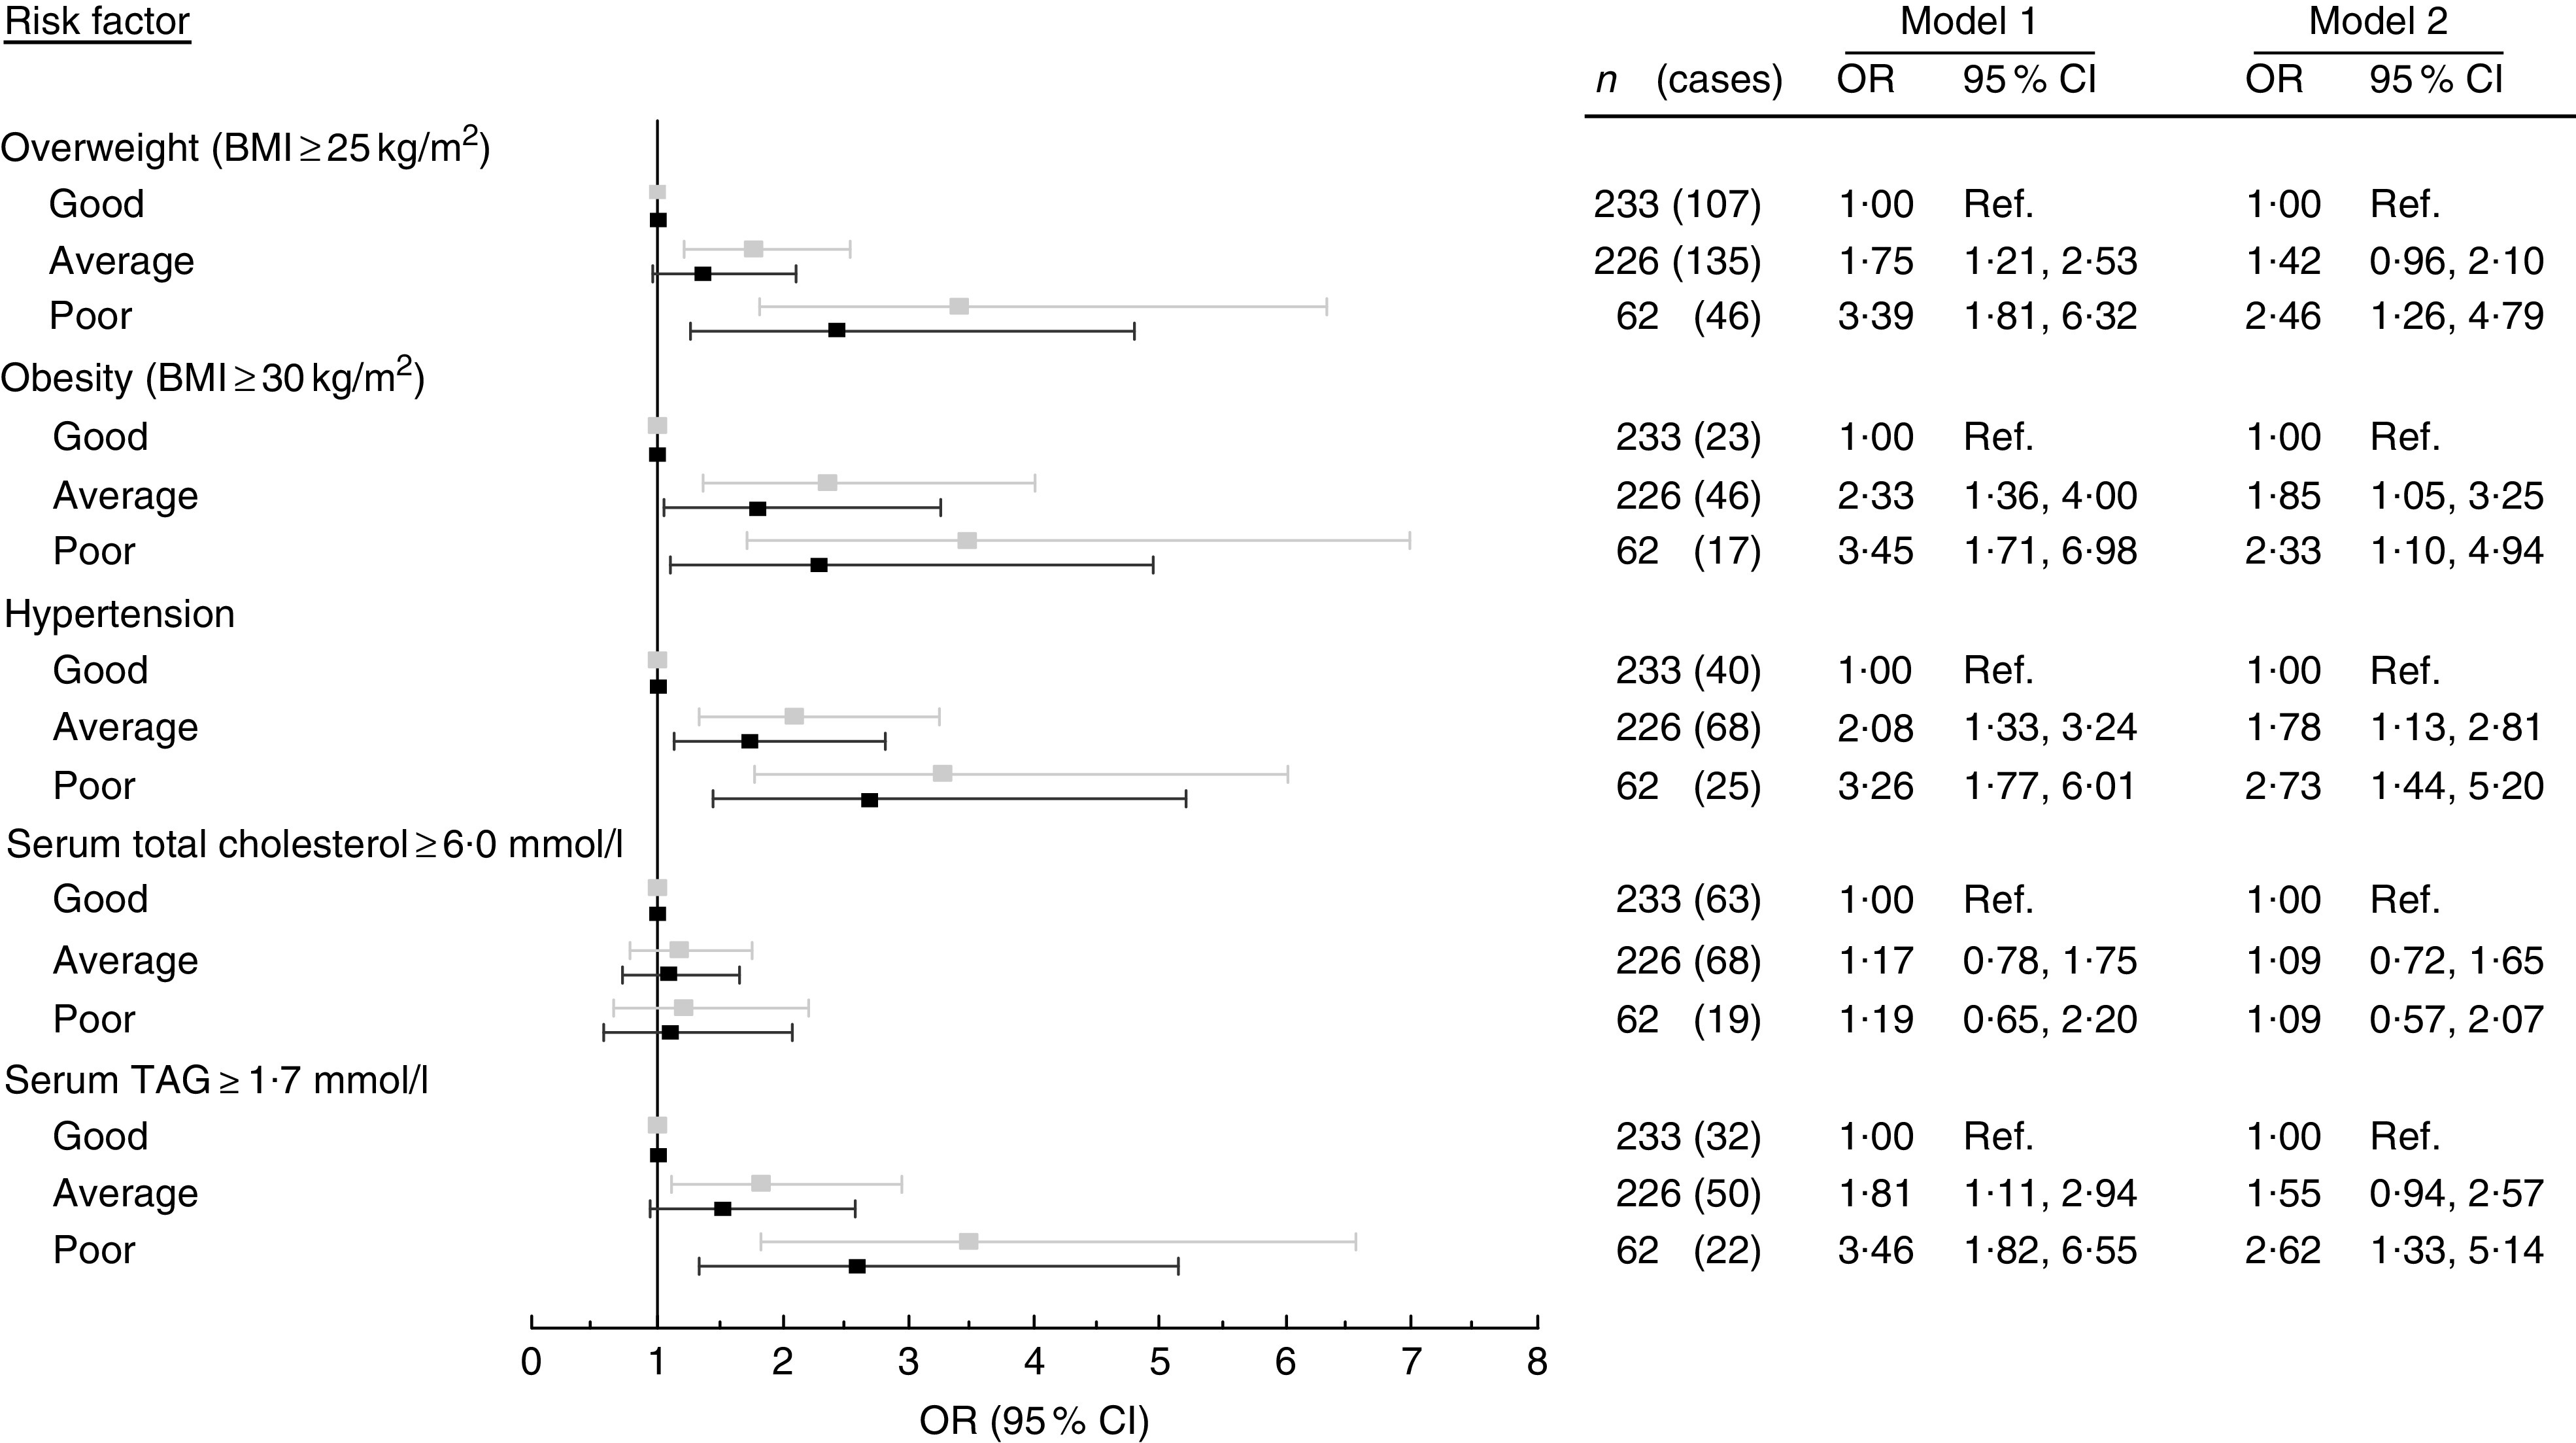
Fig. 4.

Odds of having a cardiovascular risk factor, comparing participants with a good dietary pattern (Ref., reference category) v. participants with average and poor dietary patterns, among 50-year-old men and women born in 1963 and living in Gothenburg, Sweden, 2013. Values are OR, with their 95 % CI represented by horizontal bars:  , model 1 (unadjusted);
  , model 2 (adjusted for education, smoking, sedentary lifestyle and permanent stress). Good diet meets nine or more recommendations; average diet meets six to eight recommendations; and poor diet meets five or fewer recommendations
