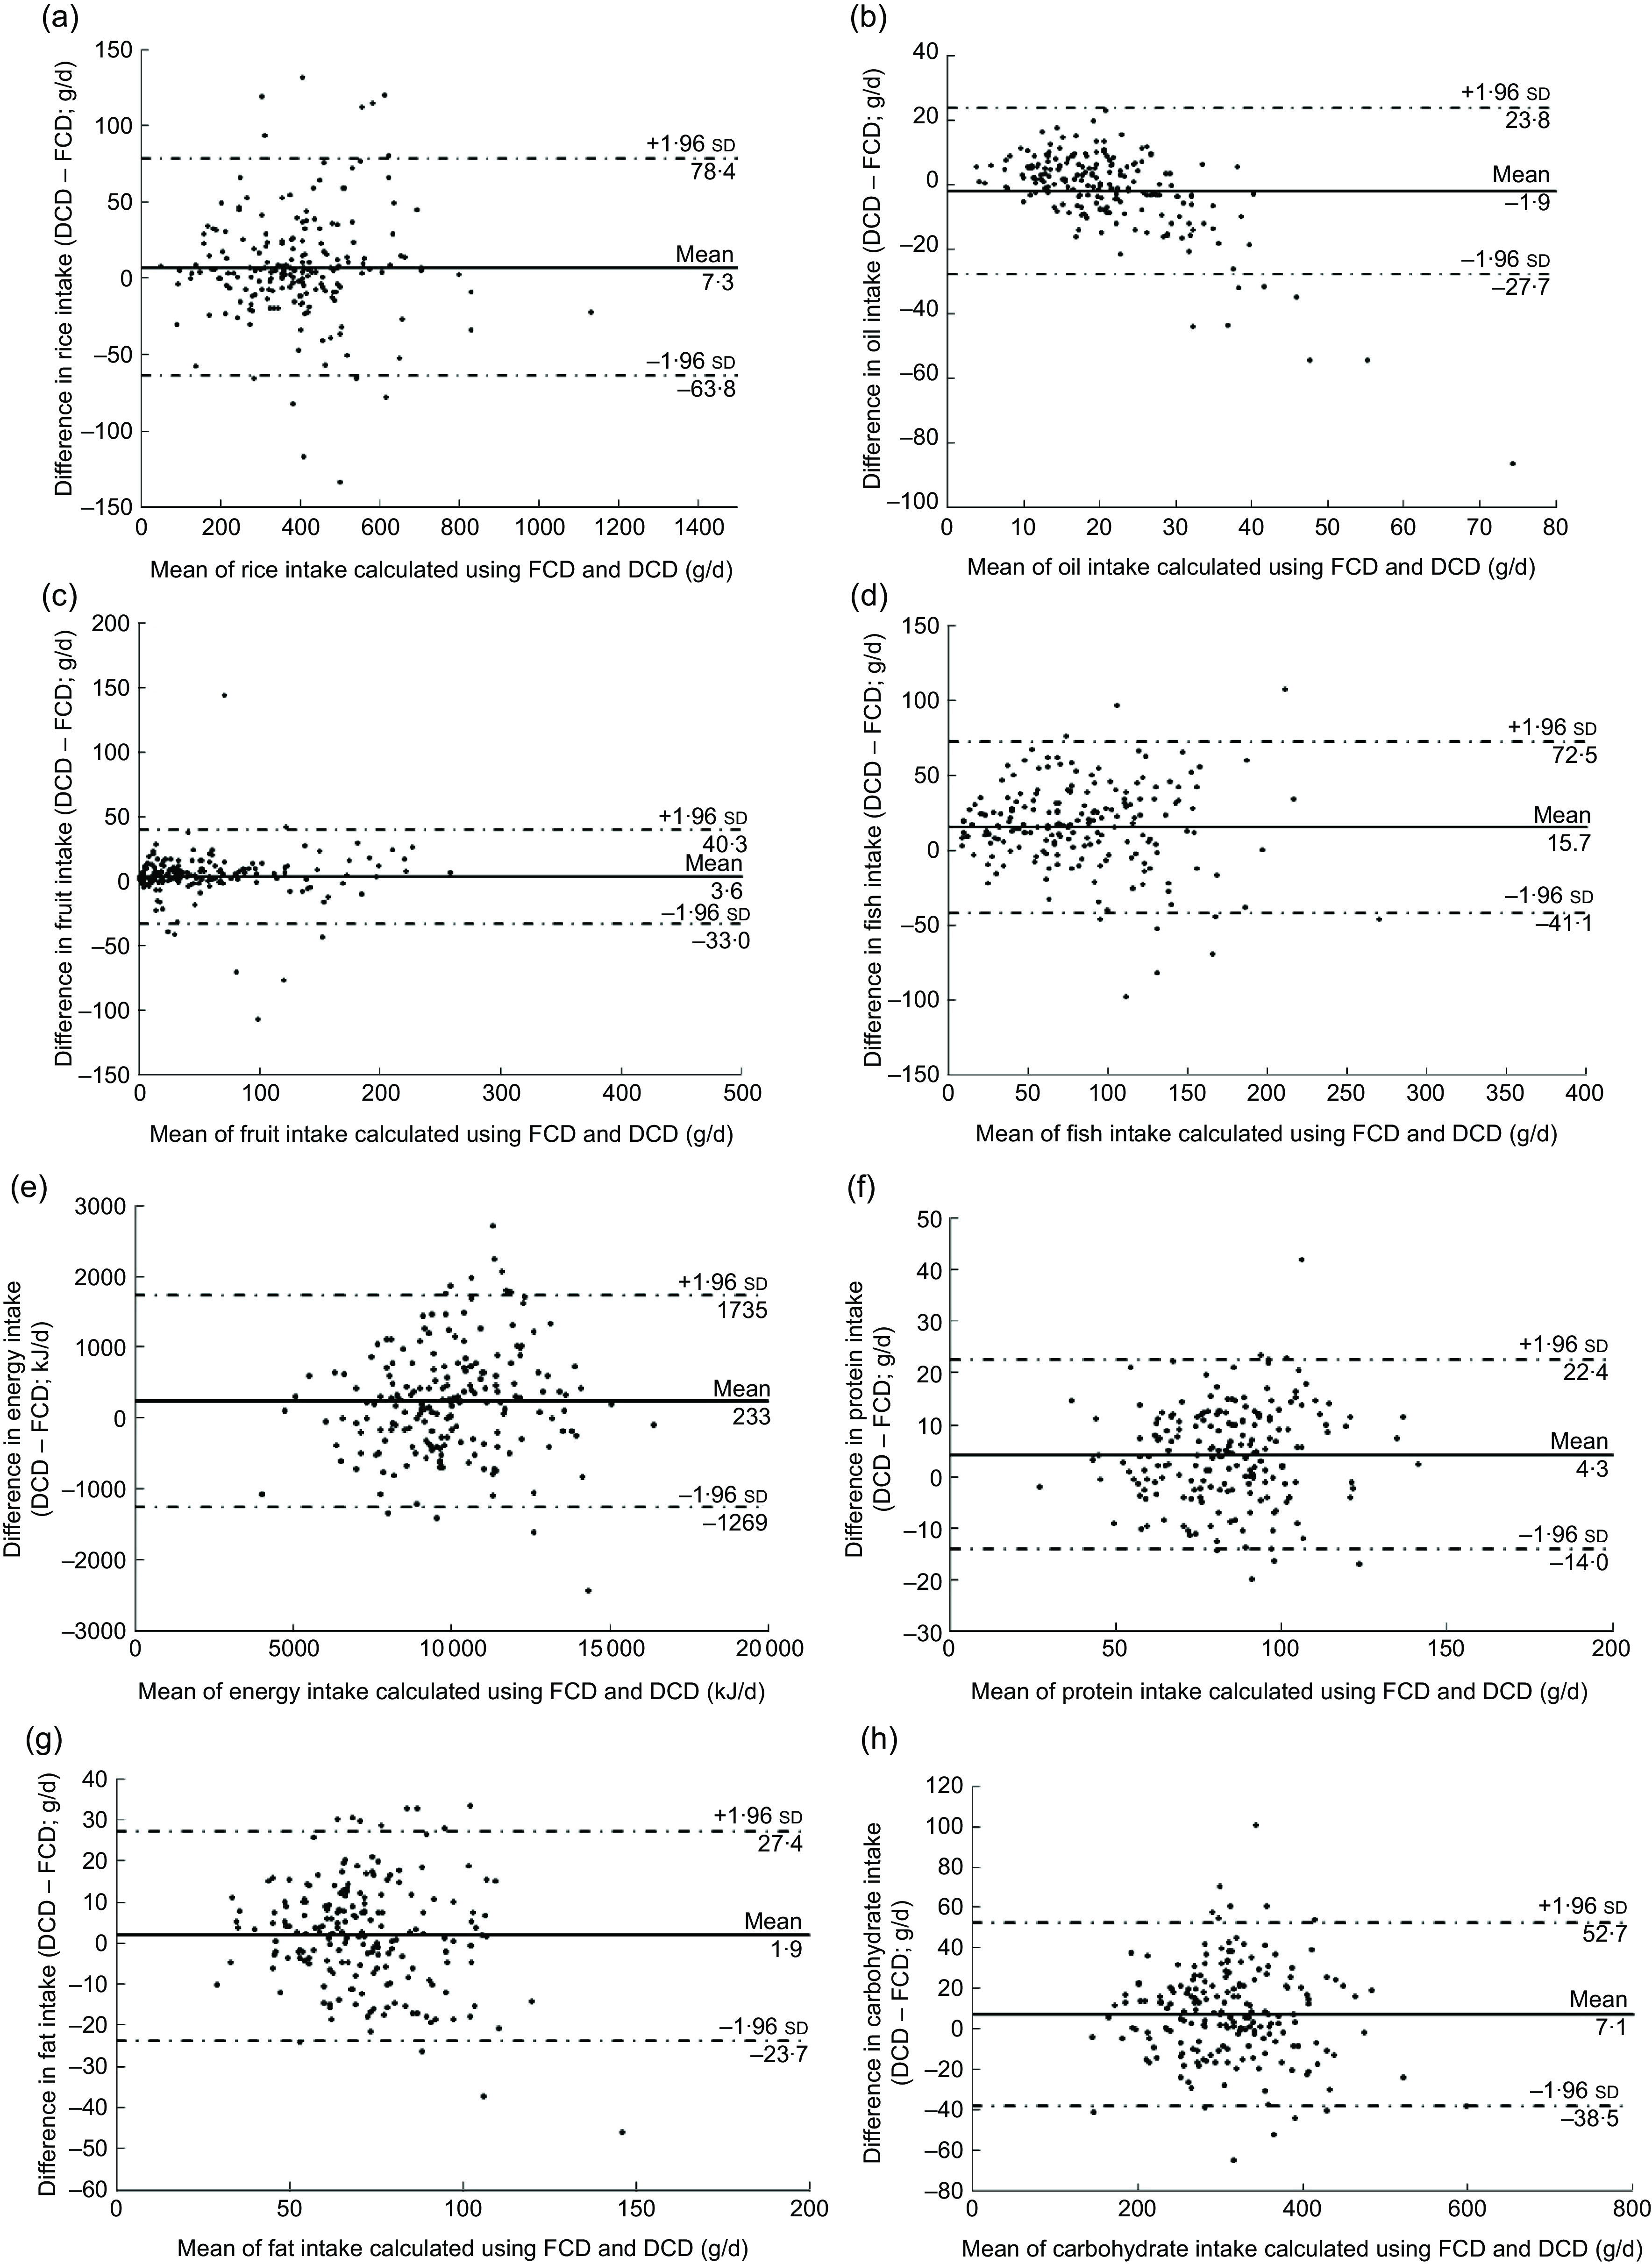
Fig. 4.

Bland–Altman plot assessing the agreement between the food composition database (FCD) and the dish composition database (DCD) with reported portion size for intakes of (a) rice, (b) oils, (c) fruits, (d) fish, (e) energy, (f) protein, (g) fat and (h) carbohydrate in Japanese men (n 196). ——— represents the mean difference and – · – · – represent the lower and upper 95 % limits of agreement
