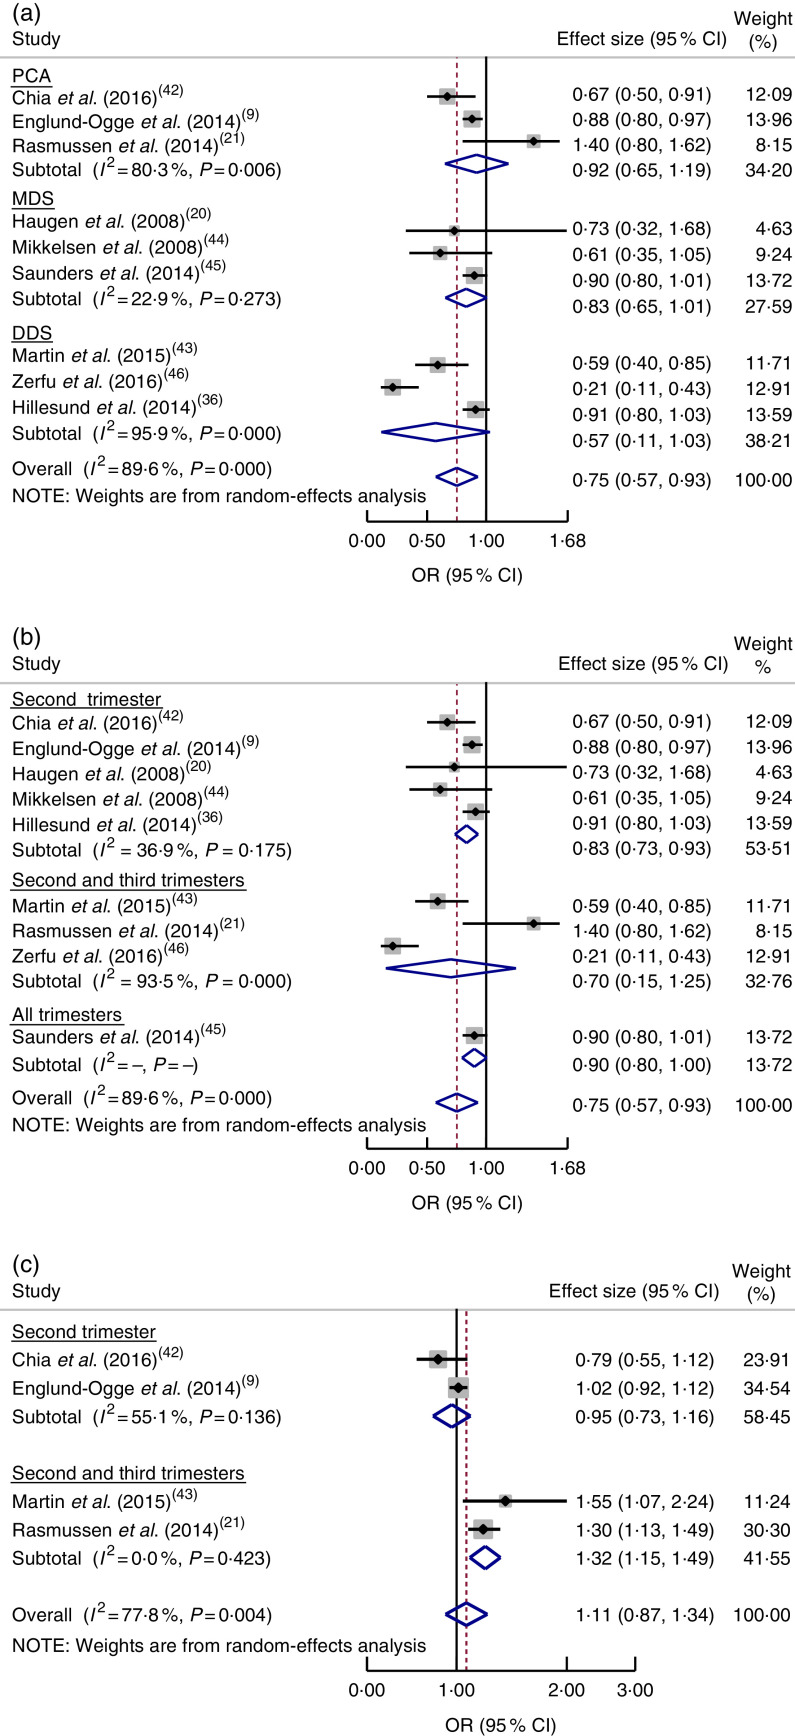
Fig. 4.
(colour online) Forest plot for the pooled OR of the association between preterm birth (PTB) and different dietary patterns: (a) association between healthy dietary pattern and PTB, with subgroup analysis in relation to dietary pattern assessment methods (Mediterranean diet score (MDS) v. dietary diversity score (DDS) v. principal component analysis (PCA)); (b) association between healthy dietary pattern and PTB, with subgroup analysis regarding period of dietary assessment (second trimester v. both second and third trimesters v. all trimesters); and (c) association between Western pattern and PTB, with subgroup analysis regarding period of dietary assessment (second trimester v. both second and third trimesters). The study-specific OR and 95 % CI are represented by the black diamond and the horizontal line, respectively; the area of the grey square is proportional to the specific-study weight to the overall meta-analysis. The centre of the blue open diamond and the red dashed vertical line represent the pooled OR; and the width of the blue open diamond represents the pooled 95 % CI

