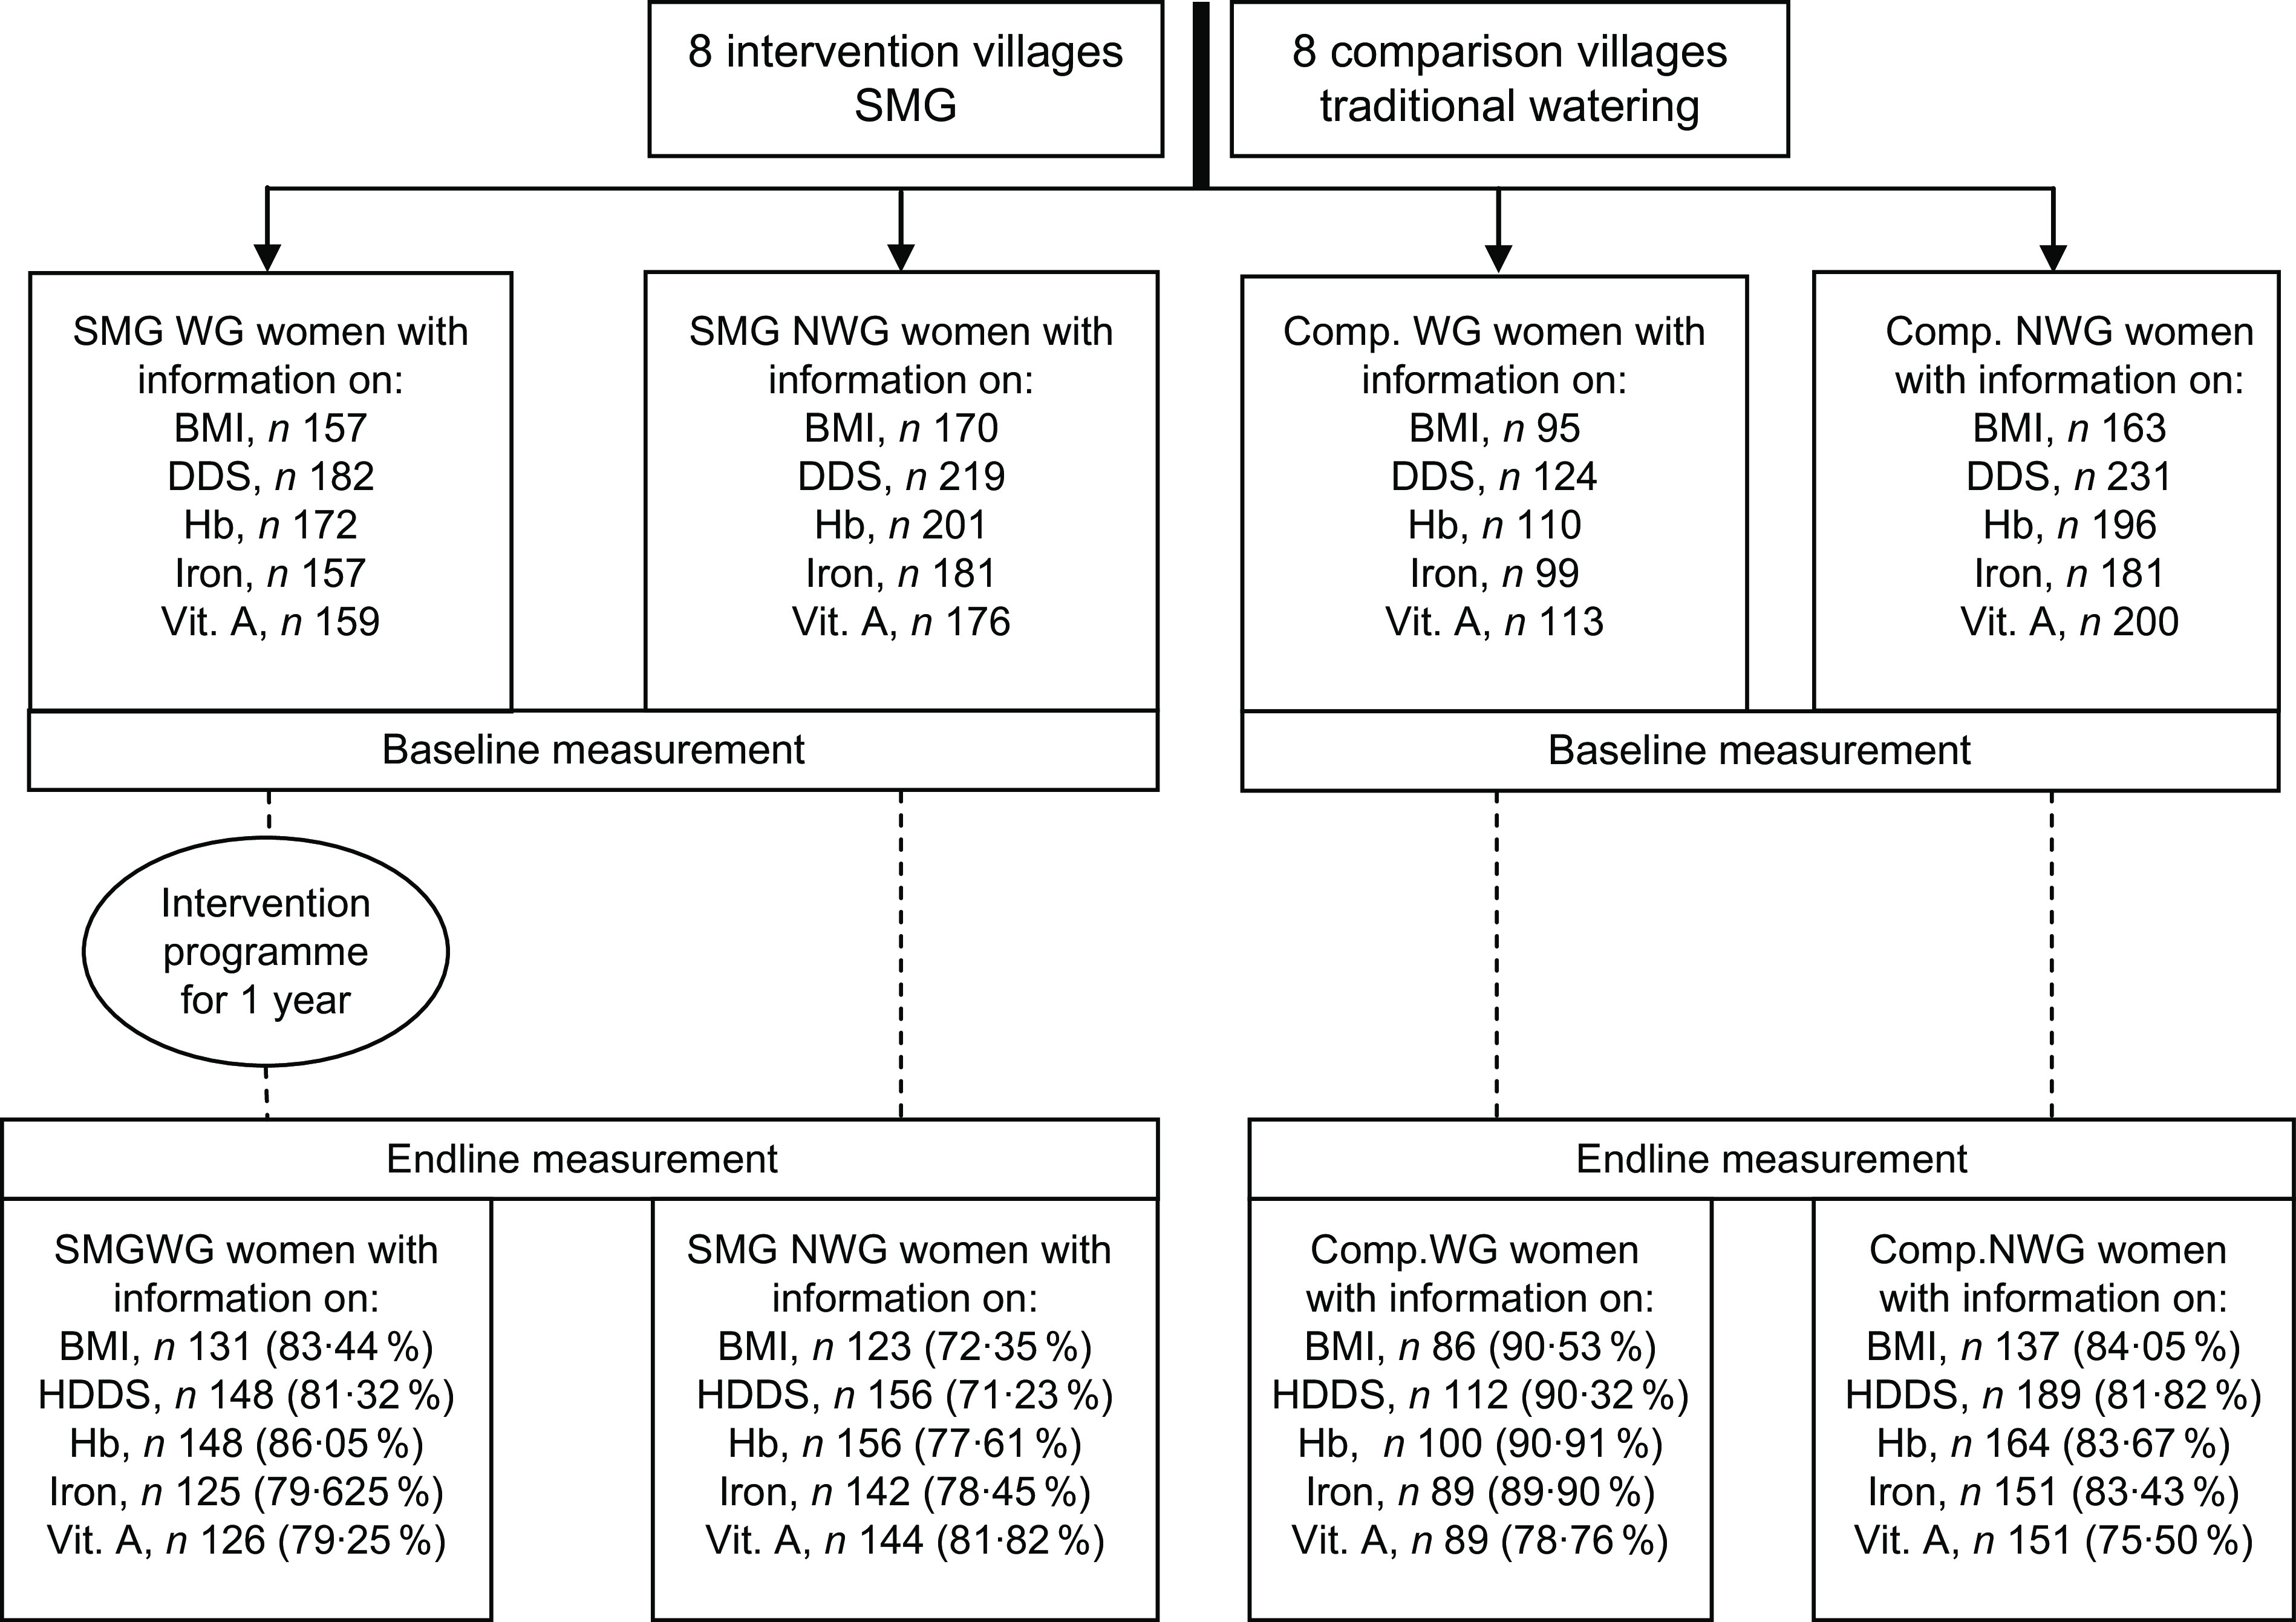
Fig. 1.

Flowchart showing the number of women aged 15–49 years with information on BMI, dietary diversity, Hb, iron and vitamin A status at baseline (January–March 2014) and after the 1-year intervention (February–March 2015) in Kalalé district, northern Benin (SMG, Solar Market Garden; WG, women’s group; NWG, non-women’s group; Comp., comparison; HDDS, Household Dietary Diversity Score; vit. A, vitamin A)
