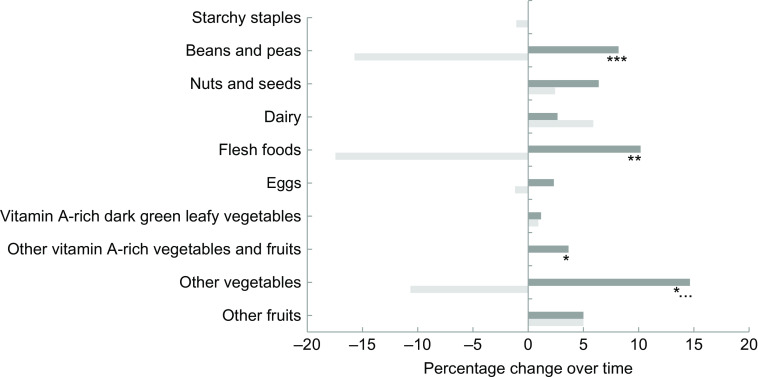
Fig. 3.
Percentage change in number of women who consumed individual food groups in the past 24 h at baseline (January–March 2014) and after the 1-year intervention (February–March 2015) among SMG WG ( ) and the other three groups (
 ), Kalalé district, northern Benin (n 1210). *P < 0·1, **P < 0·05, ***P < 0·01 for DID estimate adjusted for age, household size, latrines, electricity connection, health-care insecurity, socio-economic status and type of group (SMG, Solar Market Garden; WG, women’s group; DID, difference-in-differences)

