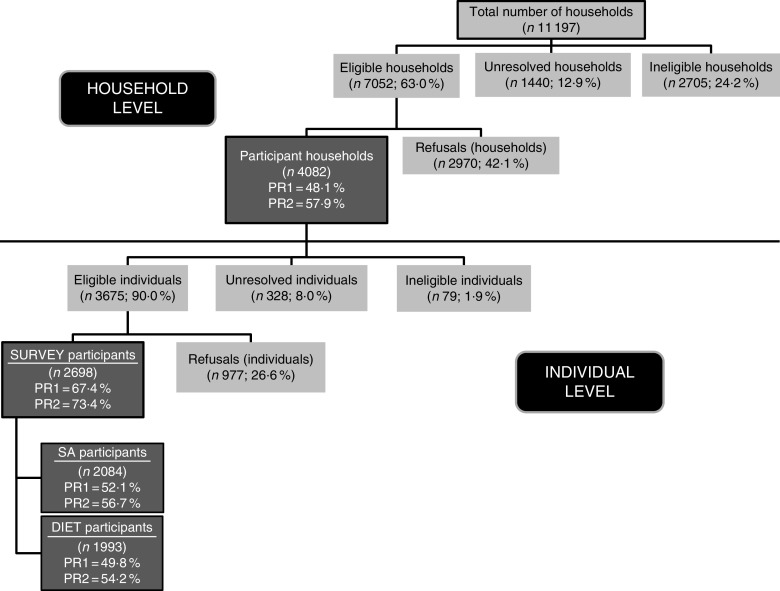
Fig. 4.
Description of the participation for the child sample in the INCA3 study (INCA3, Third French Individual and National Food Consumption Survey 2014–2015; SA, self-administered; PR1 (participation rate 1)=number of participants/(number of eligible AND unresolved individuals or households); PR2 (participation rate 2)=number of participants/number of eligible individuals or households)

