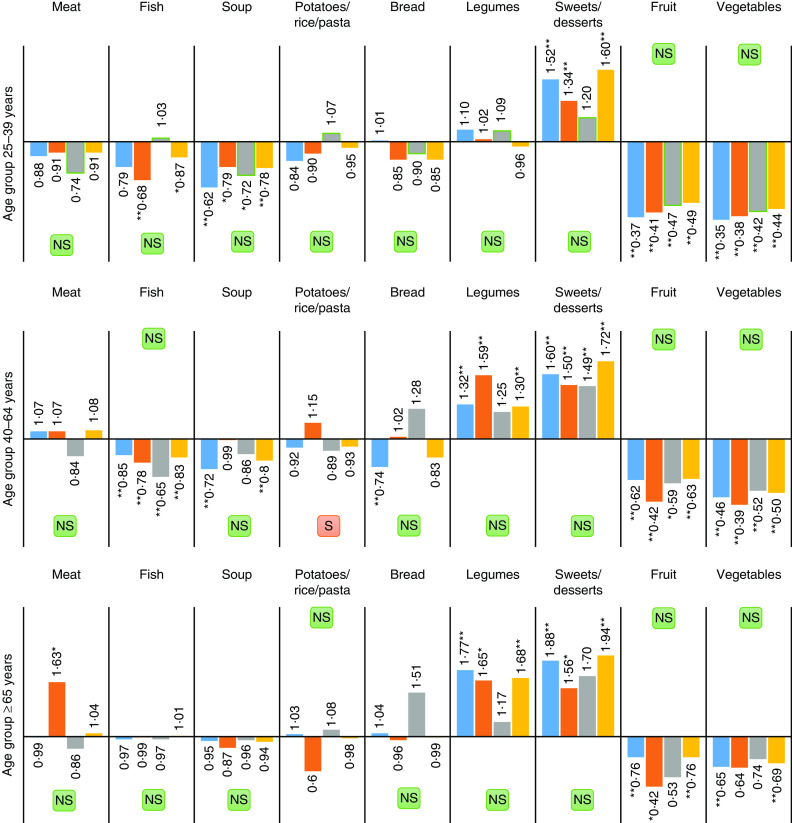
Fig.2.
(colour online) Adjusted OR for consumption of key foods in 2014 v. 2005/2006 among different age groups, stratified by education level ( , no education/pre-primary education;
  primary education/secondary education;
  tertiary education;
  all groups), controlling for sex using binary logistic regression, among Portuguese adults (n 43 273) aged 25–79 years participating in the National Health Interview Surveys of 2005/2006 and 2014. *P<0·05, **P < 0·01 (
 , significant differences in changes across sub-populations, P<0·01;
  non-significant differences in changes across sub-populations, P>0·01)

