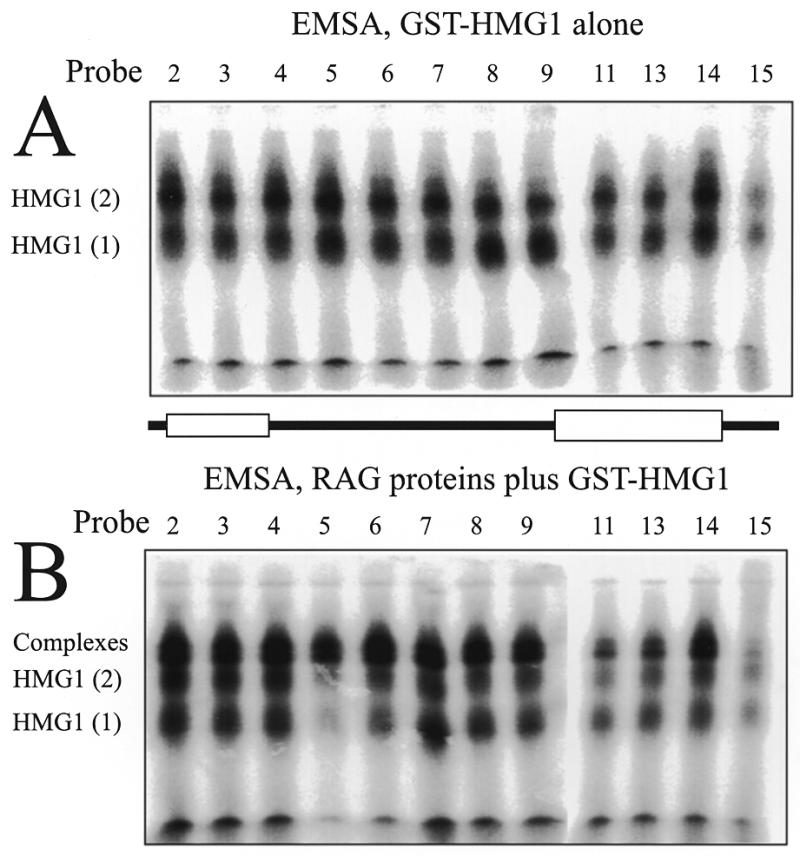
Figure 4.

EMSA shows interference by the crosslinking adduct at certain positions in formation of specific complexes. Probes numbered as in Figure 3 are compared by EMSA in ability to form the complexes with GST–HMG1 (A) or GST–HMG1 plus the RAG proteins MR1 and MR2 (B). Each image was assembled from two wet gel autoradiograms. See text for analysis.
